Fig. 3.
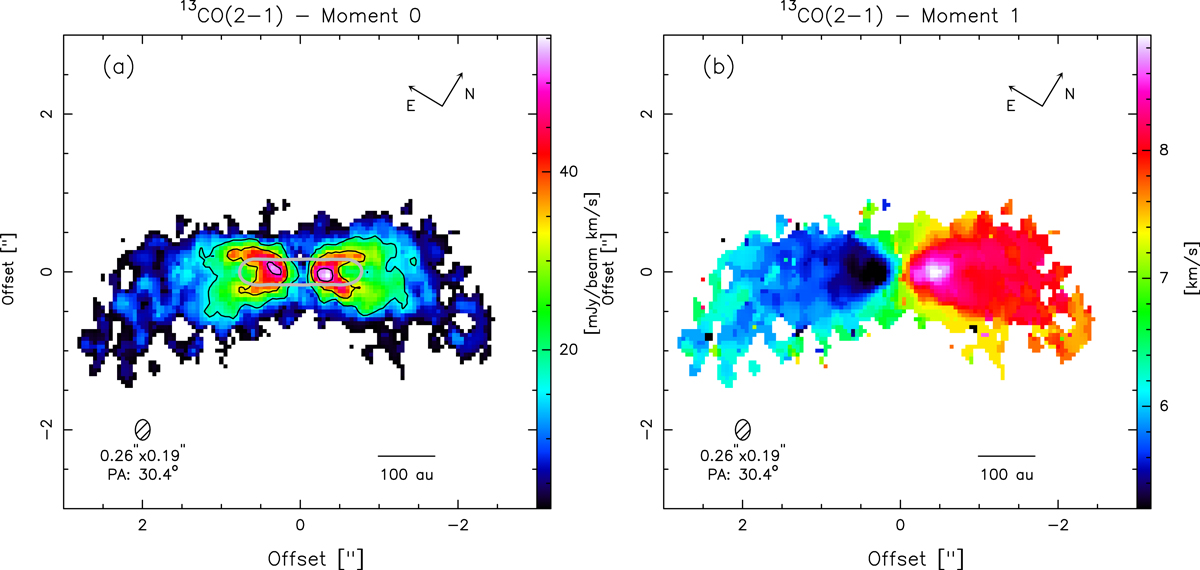
Left panel: moment zero of the 13CO(2–1) emission line integrated from 3.4 km s−1 to 11.1 km s−1. The contours start at 3σ with 3σ steps with σ = 5.55 mJy beam−1 km s−1. The contour in grey represents the level at 50σ of the continuum emission (see Fig. 1). Right panel: first moment map of the 13CO(2–1) emission line. The beam is shown in the bottom left corner and N–E orientation as indicated in the top right corner.
Current usage metrics show cumulative count of Article Views (full-text article views including HTML views, PDF and ePub downloads, according to the available data) and Abstracts Views on Vision4Press platform.
Data correspond to usage on the plateform after 2015. The current usage metrics is available 48-96 hours after online publication and is updated daily on week days.
Initial download of the metrics may take a while.