Free Access
Fig. A.4.
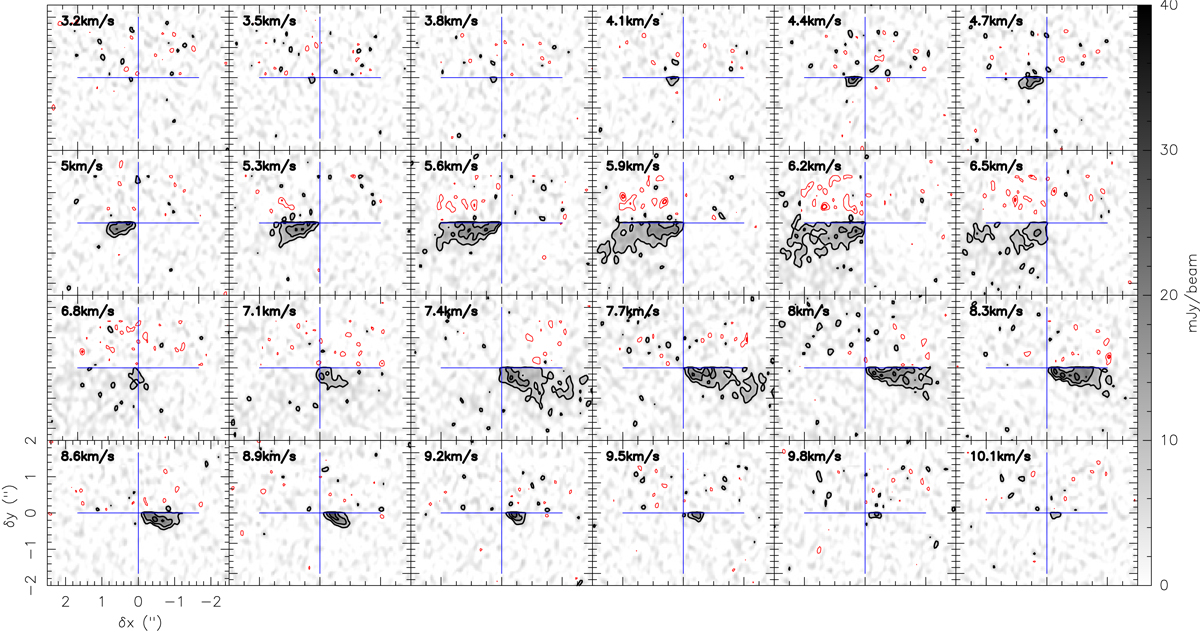
Channel maps of the residual 13CO(2–1) emission line in the top disk hemisphere after subtraction of the symmetric emission from the bottom hemisphere. The contours in black start at 3σ with 3σ steps with σ = 2.3 mJy beam−1. The red contours highlight the negative emission at −3σ and −6σ.
Current usage metrics show cumulative count of Article Views (full-text article views including HTML views, PDF and ePub downloads, according to the available data) and Abstracts Views on Vision4Press platform.
Data correspond to usage on the plateform after 2015. The current usage metrics is available 48-96 hours after online publication and is updated daily on week days.
Initial download of the metrics may take a while.