Fig. A.3.
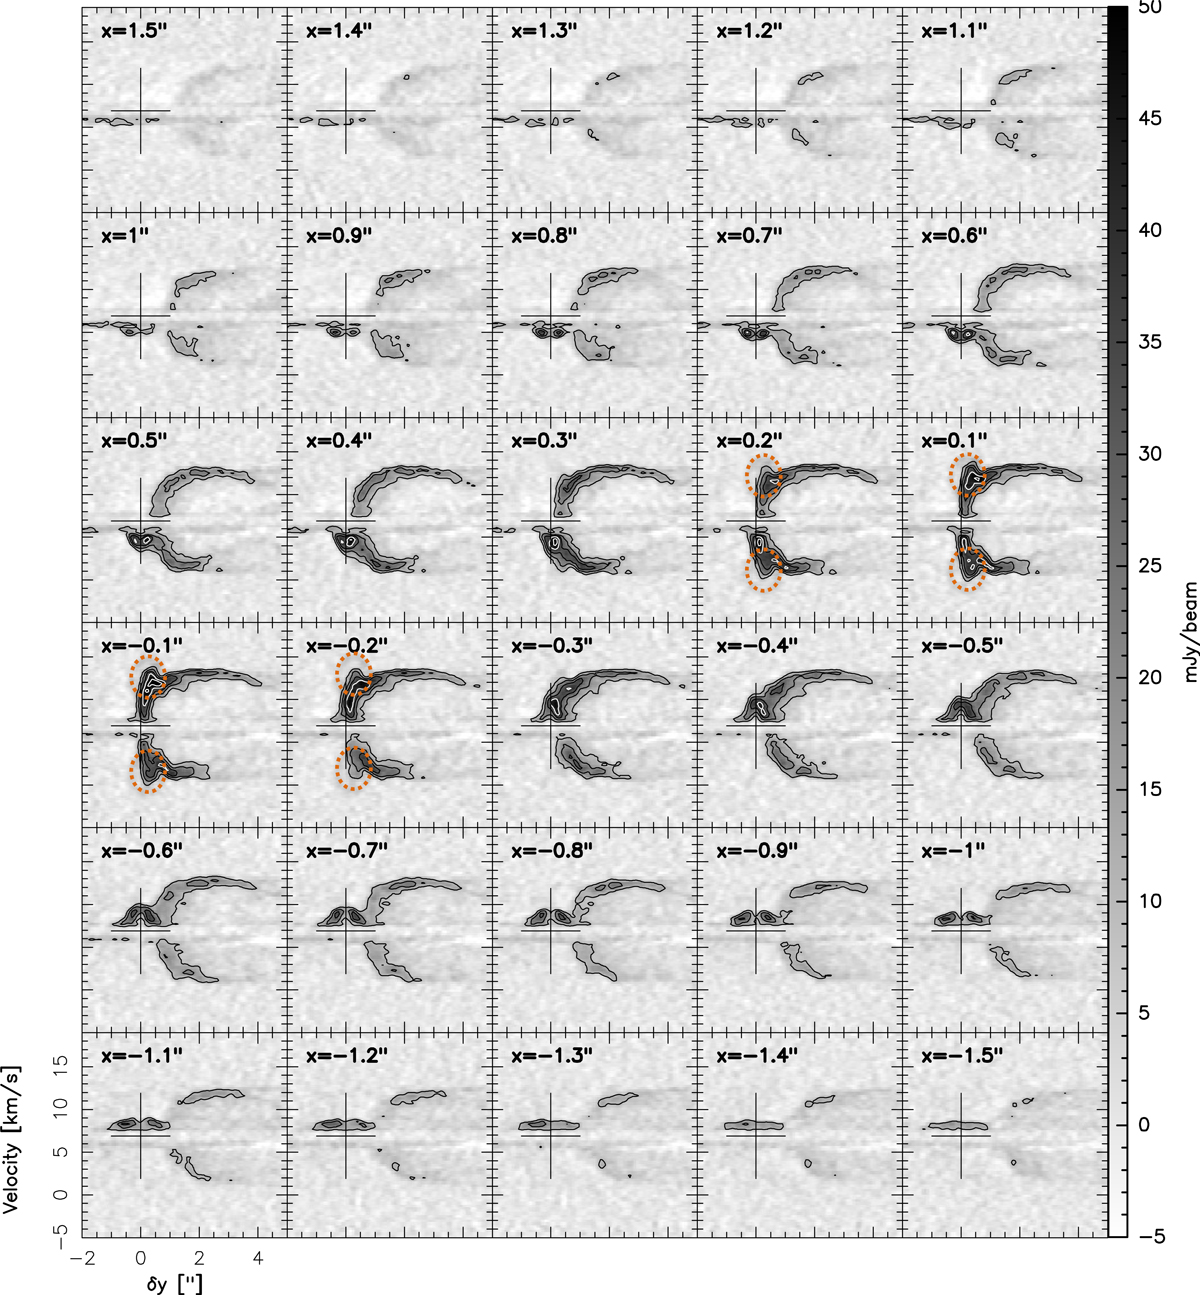
Longitudinal pv diagrams perpendicular to the disk, starting at x = 1.5″ (top left) to x = −1.5″ (bottom right). The black cross shows the central position of the disk at x = 0″ and the vlsr of HH30 at 6.9 km s−1. The contour levels start at 5σ with 5σ steps, with σ = 2.0 Jy beam−1. The orange ellipse in dashed line highlights the high-velocity component seen at y ∼ 0.25″ from x = −0.2″ to x = +0.2″. See text for more details.
Current usage metrics show cumulative count of Article Views (full-text article views including HTML views, PDF and ePub downloads, according to the available data) and Abstracts Views on Vision4Press platform.
Data correspond to usage on the plateform after 2015. The current usage metrics is available 48-96 hours after online publication and is updated daily on week days.
Initial download of the metrics may take a while.