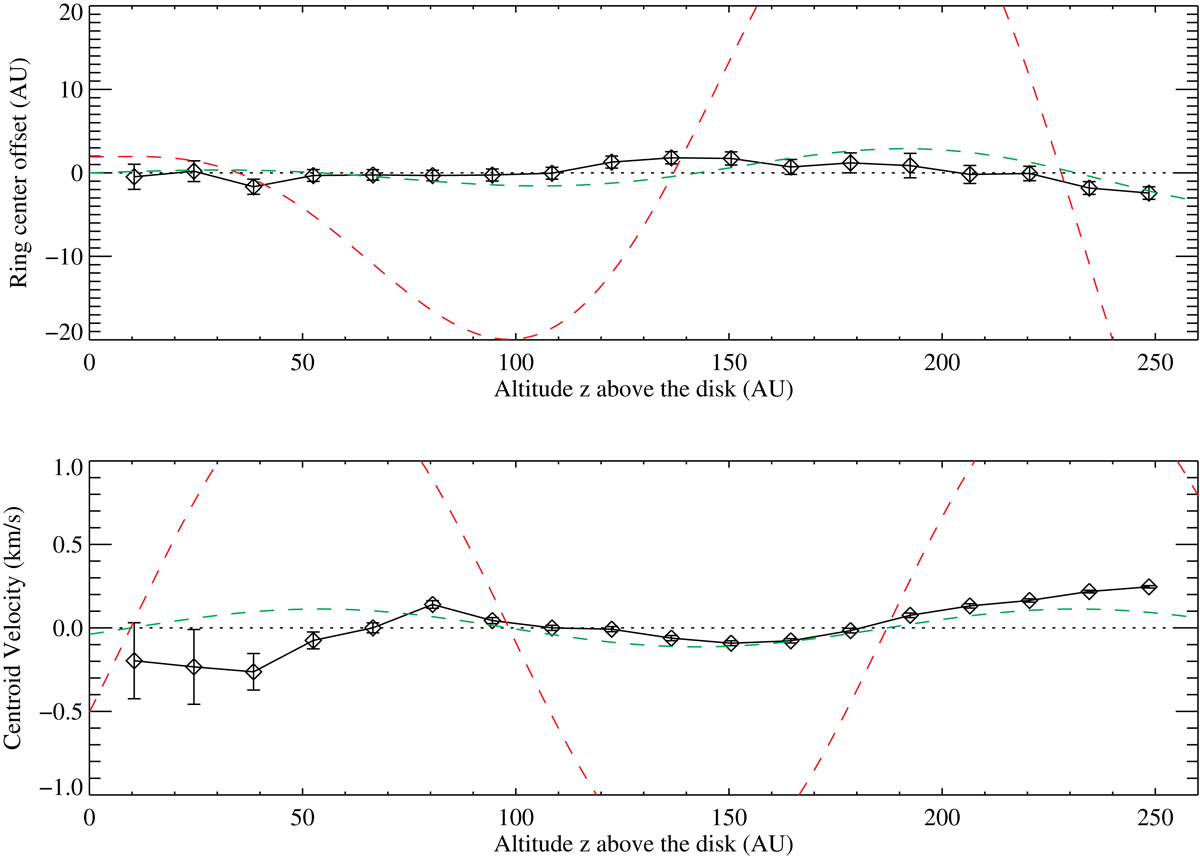
Fig. 16.

Comparison of our derived CO flow axis wiggling (top panel) and centroid velocities variation (bottom panel) along the flow axis with the expectations of orbital (red) motions and precession (green) scenarios. Both measurements have been subtracted by their mean value (1.5 au for the transverse displacements and 0.07 km s−1 for the centroid velocities). The red dashed curves shows the expected variations for the best fit orbital solution derived by Estalella et al. (2012), assuming that the CO flow is arising from the same CS disk as the atomic jet. The green dashed curve shows the variations expected in the equivalent precessing model (see text for more details).
Current usage metrics show cumulative count of Article Views (full-text article views including HTML views, PDF and ePub downloads, according to the available data) and Abstracts Views on Vision4Press platform.
Data correspond to usage on the plateform after 2015. The current usage metrics is available 48-96 hours after online publication and is updated daily on week days.
Initial download of the metrics may take a while.


