Fig. 13.
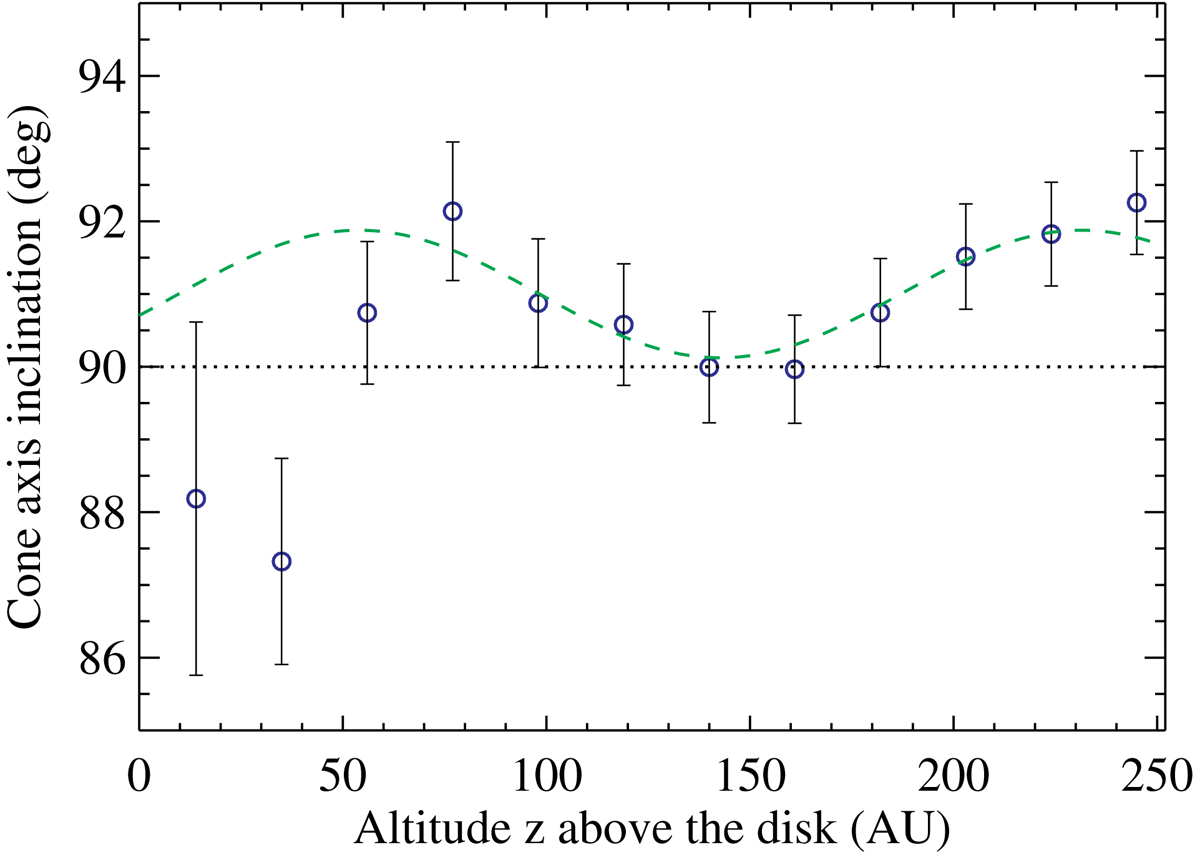
Variation of the CO flow axis inclination to the line-of-sight i derived from the observed variation of ![]() assuming that the gas flows along the conical surface of semi-opening angle θ = 35∘. Plotted error bars include the 1σ uncertainty on Vlsr and θ. The dashed green curve shows the prediction from the precession model that best fits the centre position and centroid velocity wiggling of the CO flow axis. See Sect. 5.1.3 for more details.
assuming that the gas flows along the conical surface of semi-opening angle θ = 35∘. Plotted error bars include the 1σ uncertainty on Vlsr and θ. The dashed green curve shows the prediction from the precession model that best fits the centre position and centroid velocity wiggling of the CO flow axis. See Sect. 5.1.3 for more details.
Current usage metrics show cumulative count of Article Views (full-text article views including HTML views, PDF and ePub downloads, according to the available data) and Abstracts Views on Vision4Press platform.
Data correspond to usage on the plateform after 2015. The current usage metrics is available 48-96 hours after online publication and is updated daily on week days.
Initial download of the metrics may take a while.