Fig. 12.
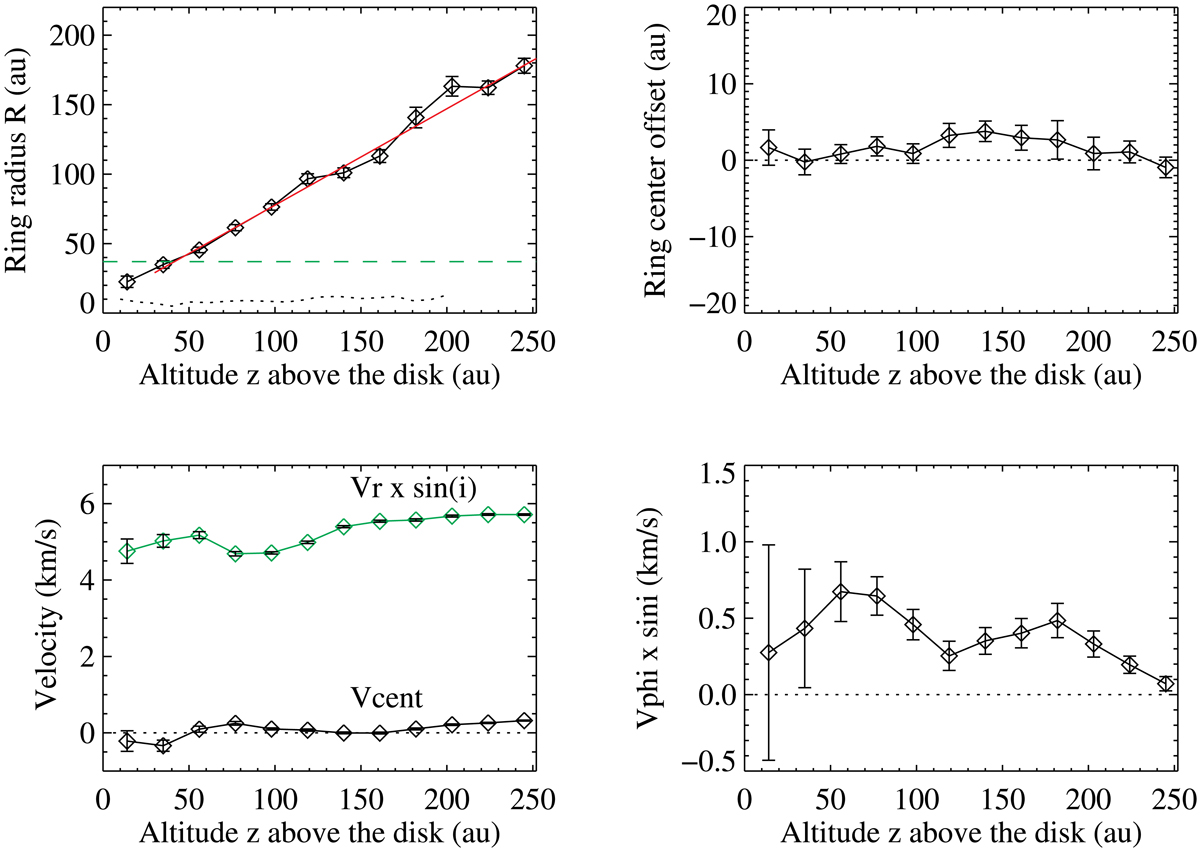
Variation of the ring parameters and their 1 σ error bars derived from fitting the transverse pv diagrams, as a function of the distance z above the disk plane. Top left panel: symbols show the CO ring radius as a function of z. The red line shows a linear fit giving a semi-opening angle of 35 ± 1∘. The radii increase linearly consistent with a conical geometry down to z = 15 au. The dashed green line locates the expected inner radius of the disk at r = 37 au in the binary scenario from Estalella et al. (2012). The dotted line plots the atomic jet radius derived from HST observations by Hartigan & Morse (2007). Top right panel: variation of the ring centre displacement with respect to the continuum central x position, as a function of z. Bottom left panel: variation of Vcent (Black symbols) and Vr × sin i (Green symbols) as a function of z. Error bars include uncertainties on the source Vlsr. Negative values of Vcent correspond to blue-shifted emission with respect to Vlsr. Bottom right panel: Variation of Vϕ × sin i as a function of z. A consistent positive rotation signature in the same sense as the disk is detected in the central z ≤ 250 au of the flow.
Current usage metrics show cumulative count of Article Views (full-text article views including HTML views, PDF and ePub downloads, according to the available data) and Abstracts Views on Vision4Press platform.
Data correspond to usage on the plateform after 2015. The current usage metrics is available 48-96 hours after online publication and is updated daily on week days.
Initial download of the metrics may take a while.