Fig. 11.
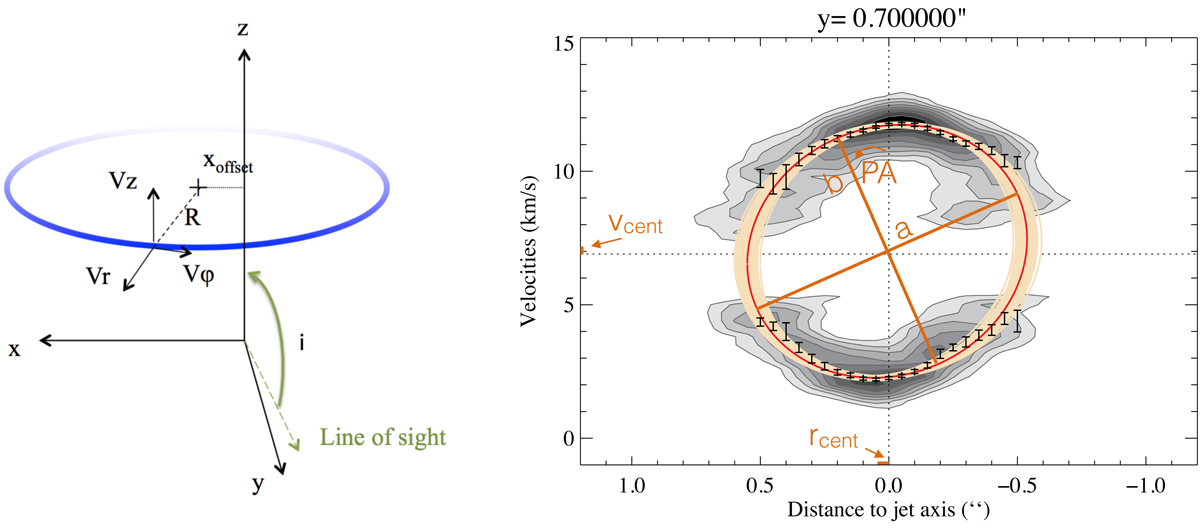
Left panel: sketch of the ring model used to fit the transverse pv diagrams. The ring model is defined by five parameters illustrated in the figure and discussed in the text. Right panel: illustration of the fitting procedure performed on the transverse pv diagram at z = +0.7″. The black crosses show the trace determined according to the method described in text. The red line shows the result of the fit of this trace by an ellipse. The yellow ellipses show the distribution of solutions taking into account the estimated 1σ error on the five ring parameters. See text for more details.
Current usage metrics show cumulative count of Article Views (full-text article views including HTML views, PDF and ePub downloads, according to the available data) and Abstracts Views on Vision4Press platform.
Data correspond to usage on the plateform after 2015. The current usage metrics is available 48-96 hours after online publication and is updated daily on week days.
Initial download of the metrics may take a while.