Fig. 10.
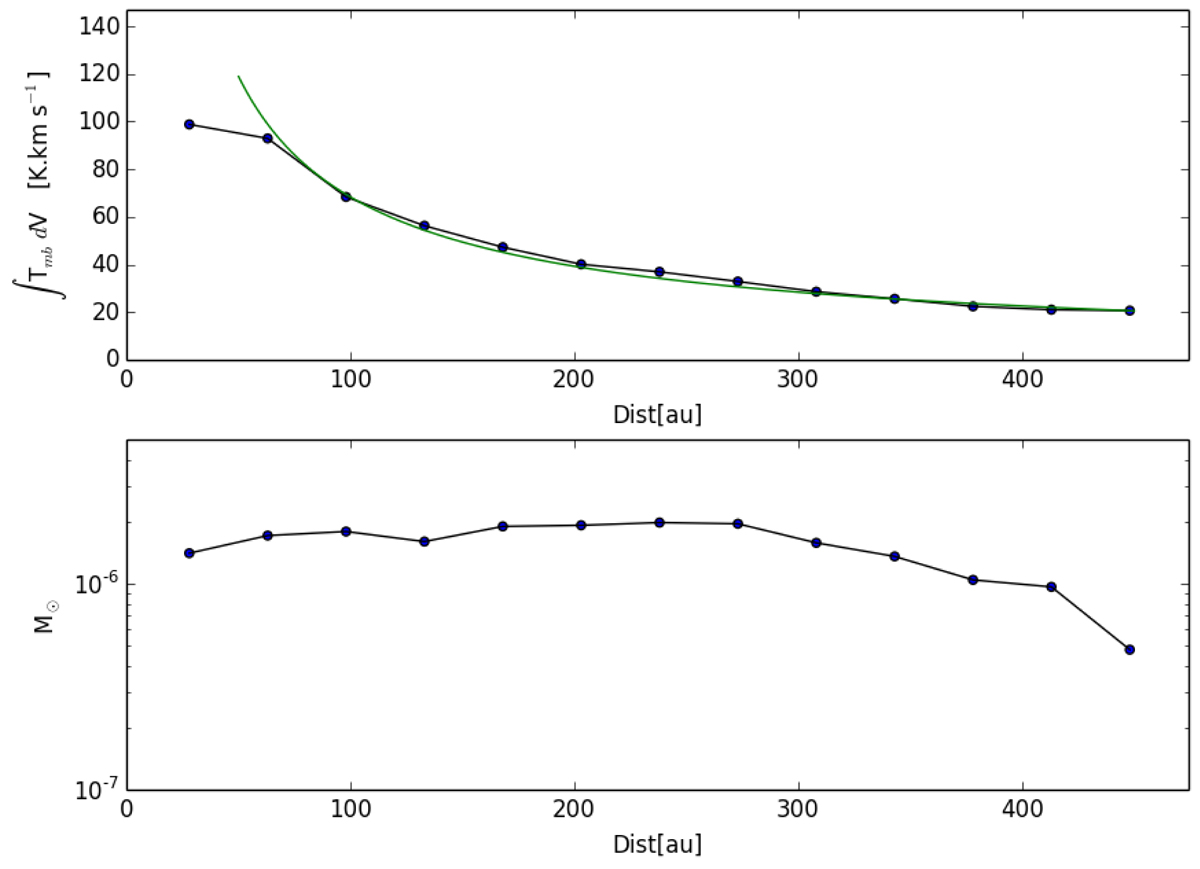
Top panel: mean integrated line temperature of 12CO(2–1) in K km s−1 (averaged over the area above 5σ in each “slice” of Fig. 5) as a function of distance along the cone axis. The overplotted curve in green is defined by T ∝ z−4/5. Bottom panel: mass in slices of thickness 30 au as a function of distance along the axis, using our lower limit to Tex of 30 K. The constancy with z could indicate a steady mass flux rate along the cone walls; see Sect. 4.2.
Current usage metrics show cumulative count of Article Views (full-text article views including HTML views, PDF and ePub downloads, according to the available data) and Abstracts Views on Vision4Press platform.
Data correspond to usage on the plateform after 2015. The current usage metrics is available 48-96 hours after online publication and is updated daily on week days.
Initial download of the metrics may take a while.