Fig. 1.
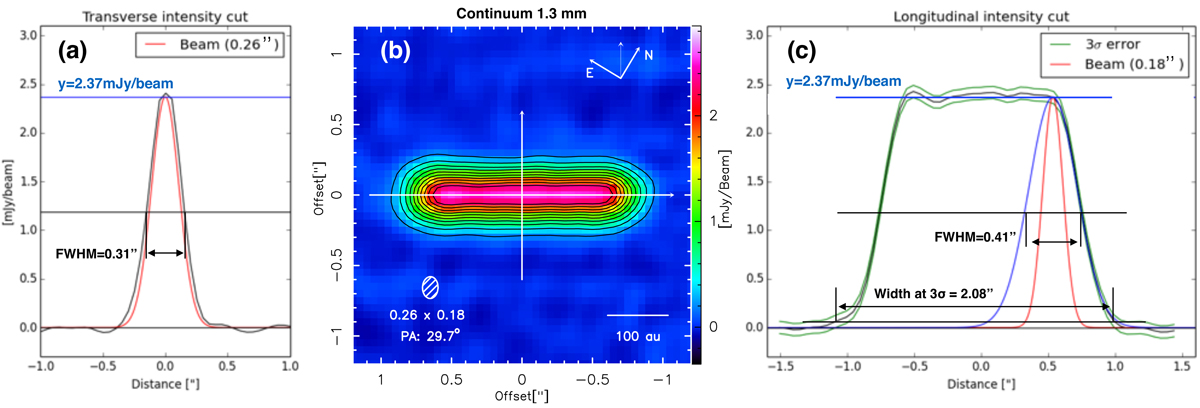
HH30 1.33 mm continuum emission. Left panel: intensity cut across the minor axis of the disk (black curve) compared to the beam (red curve). Middle panel: continuum emission map at 1.33 mm rotated by 31∘ and centred at α(J2000) = 04:31:37.5 and δ(J2000) = 18:12:23.8. The contours start at 10σ with 10σ steps. The 1σ noise level is of 21.74 μJy beam−1. The white arrows localise the intensity cuts along and across the disk that are shown in the right and left panel, respectively. Right panel: intensity cut along the major axis of the disk. The blue Gaussian adjusts the decrease in flux beyond d = 0.54″ (r = 75 au), which is broader than the beam (red curve). The green curves represent the ±3σ variation of the longitudinal intensity profile.
Current usage metrics show cumulative count of Article Views (full-text article views including HTML views, PDF and ePub downloads, according to the available data) and Abstracts Views on Vision4Press platform.
Data correspond to usage on the plateform after 2015. The current usage metrics is available 48-96 hours after online publication and is updated daily on week days.
Initial download of the metrics may take a while.