Fig. 6.
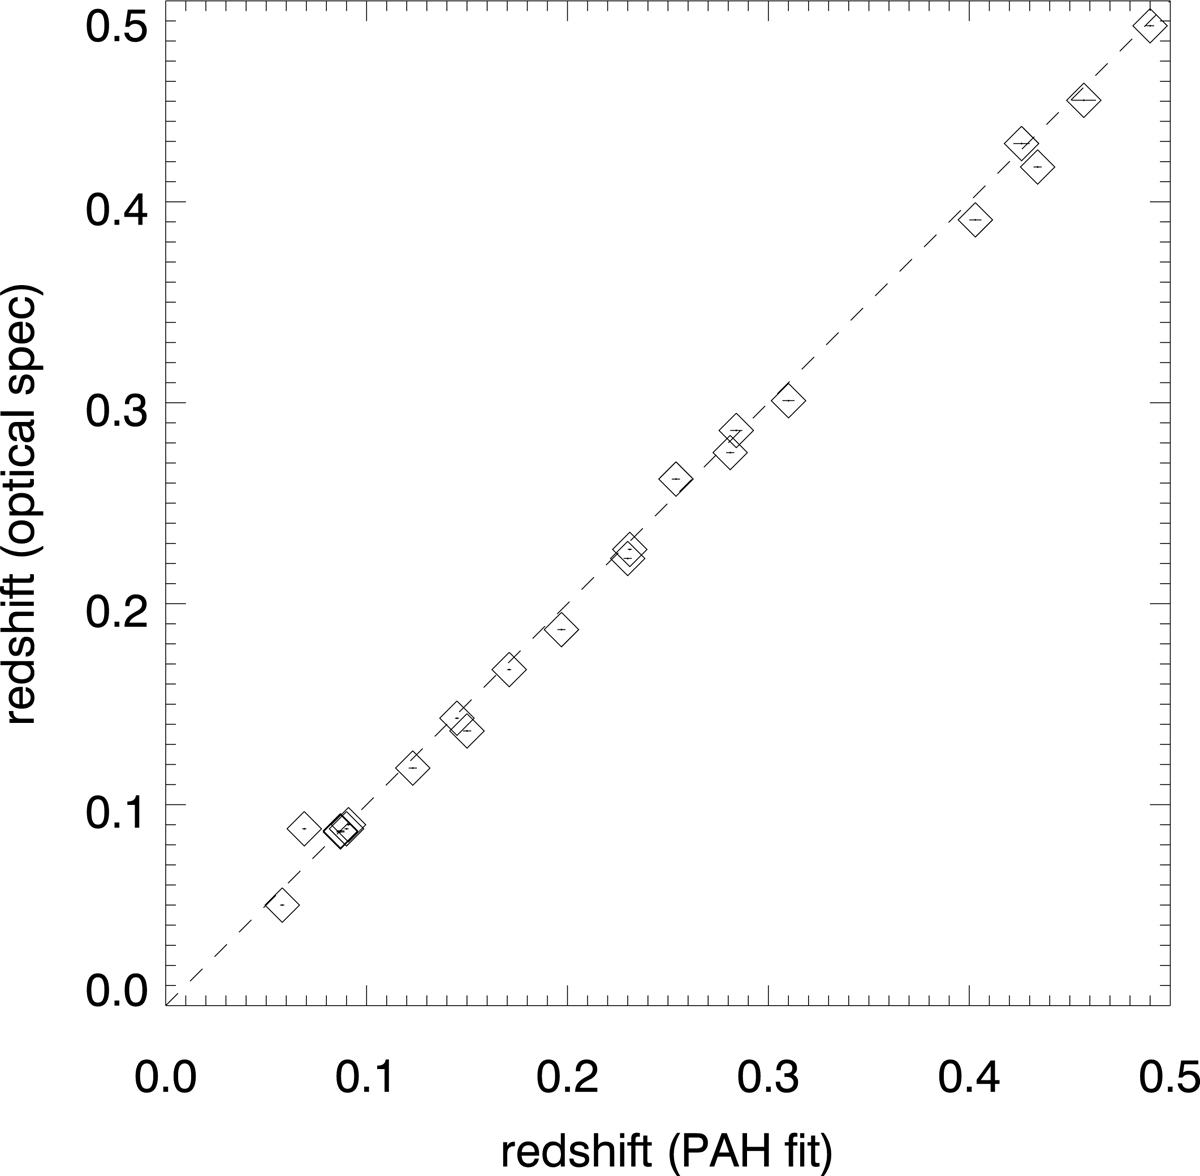
Comparison of the redshifts between the PAH fit and optical spectroscopy for the PAH galaxies. Error of the optical spectroscopic redshift is not shown, but we plot only the sources with good redshift measurements (quality flag of 3 or 4 in Shim et al. 2013; see text). The diagonal broken line is for the same redshifts in the two measurements.
Current usage metrics show cumulative count of Article Views (full-text article views including HTML views, PDF and ePub downloads, according to the available data) and Abstracts Views on Vision4Press platform.
Data correspond to usage on the plateform after 2015. The current usage metrics is available 48-96 hours after online publication and is updated daily on week days.
Initial download of the metrics may take a while.