Fig. 5.
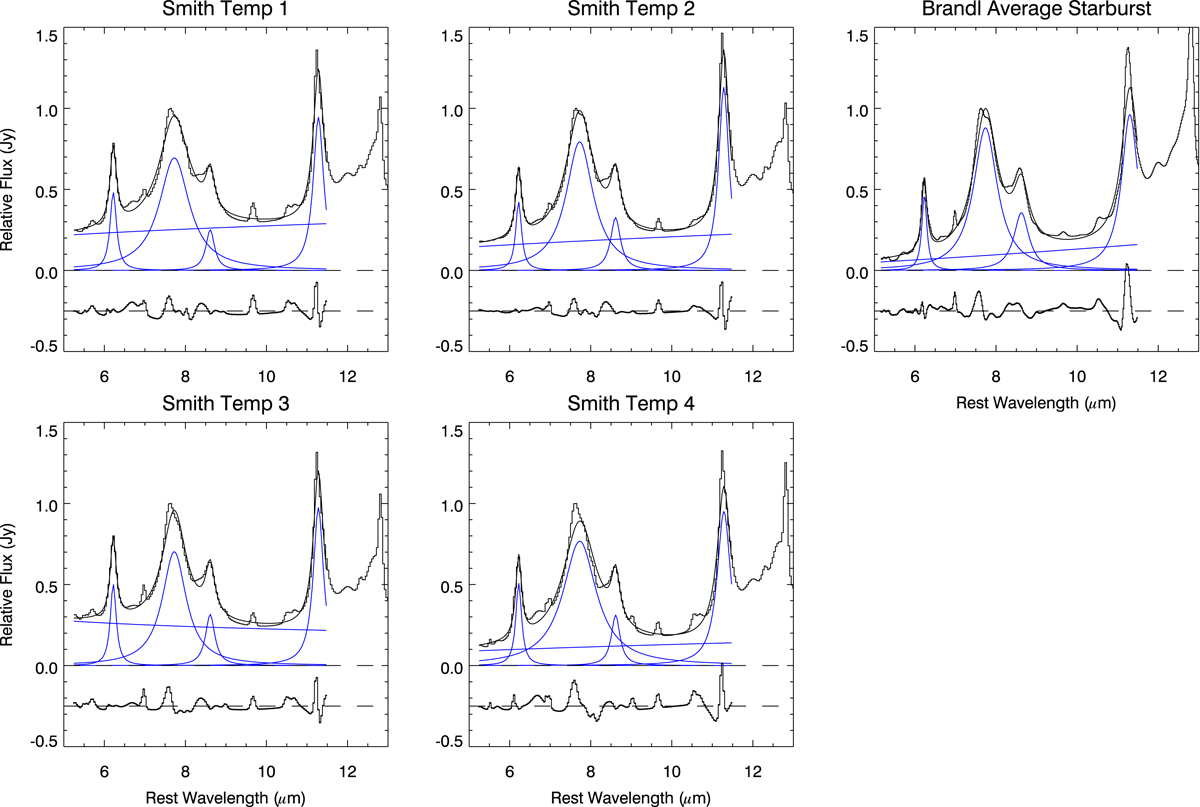
Representative IRS spectra of star-forming galaxies with the PAH fit results overlaid. An averaged spectrum of nearby starburst galaxies of Brandl et al. (2006; top right) and four “noise-free galaxy spectral templates” of Smith et al. (2007; remaining four panels) are shown in black lines. The individual PAH features (blue), the power-law continuum (blue), and their sum (black) are overlaid in each panel. The residual of the fit (observed–fitted) is shown at offset baseline (horizontal broken line) for clarity.
Current usage metrics show cumulative count of Article Views (full-text article views including HTML views, PDF and ePub downloads, according to the available data) and Abstracts Views on Vision4Press platform.
Data correspond to usage on the plateform after 2015. The current usage metrics is available 48-96 hours after online publication and is updated daily on week days.
Initial download of the metrics may take a while.