Fig. 4.
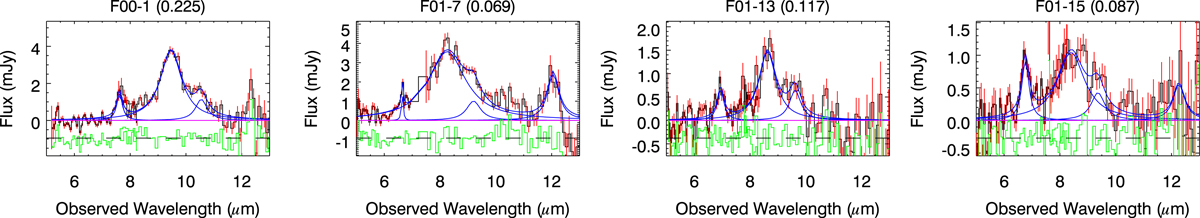
Example SG1 and SG2 spectra of the SPICY PAH galaxies with the PAH fit results overlaid. All 48 spectra can be found in Fig. B.1. The observed spectrum is shown in red line with one-sigma error bars, with the fitted individual PAH components (blue), the power-law continuum (magenta), and their sum (blue) in each panel. The residual of the fit (observed–fitted) is shown in green at offset baseline (horizontal broken line) for clarity. The redshift from the PAH fit is indicated next to the source name in the plot title. The Y axis is scaled to have the same PAH 7.7 μm peak hight for all galaxies.
Current usage metrics show cumulative count of Article Views (full-text article views including HTML views, PDF and ePub downloads, according to the available data) and Abstracts Views on Vision4Press platform.
Data correspond to usage on the plateform after 2015. The current usage metrics is available 48-96 hours after online publication and is updated daily on week days.
Initial download of the metrics may take a while.