Fig. 3.
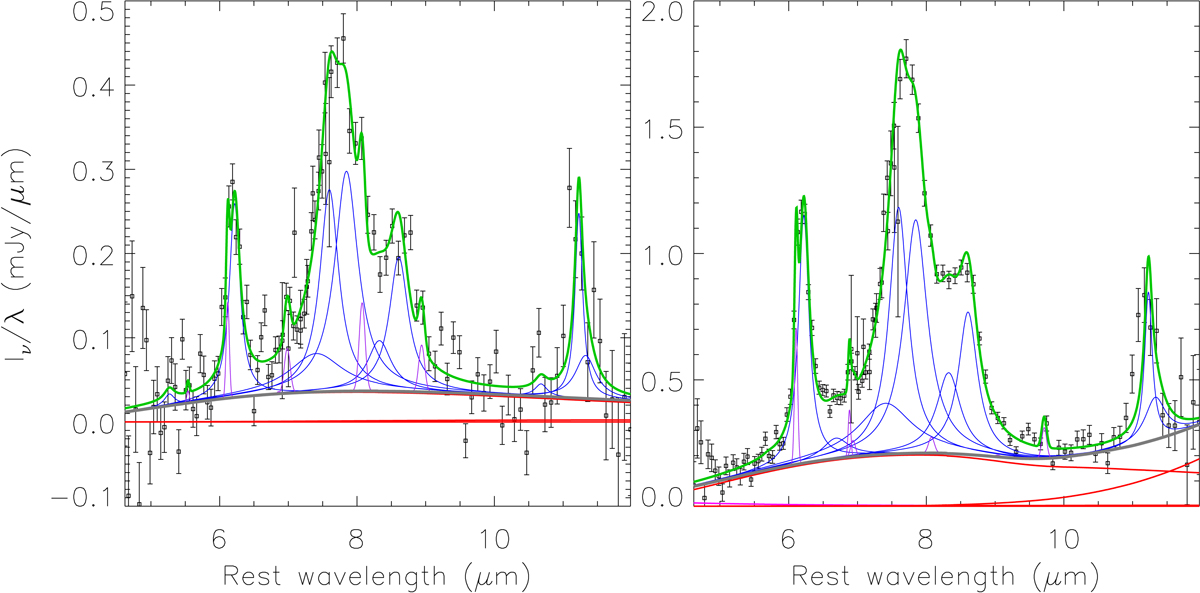
Results of the PAHFIT for two nearby SPICY PAH galaxies. Individual PAH features (blue), narrow emission lines (magenta), dust continua (multiple components for different temperatures; red), stellar continuum (magenta), sum of the continua (dust and stellar; grey), and sum of all components (continua and spectral features; green) are shown for each galaxy.
Current usage metrics show cumulative count of Article Views (full-text article views including HTML views, PDF and ePub downloads, according to the available data) and Abstracts Views on Vision4Press platform.
Data correspond to usage on the plateform after 2015. The current usage metrics is available 48-96 hours after online publication and is updated daily on week days.
Initial download of the metrics may take a while.