Fig. 21.
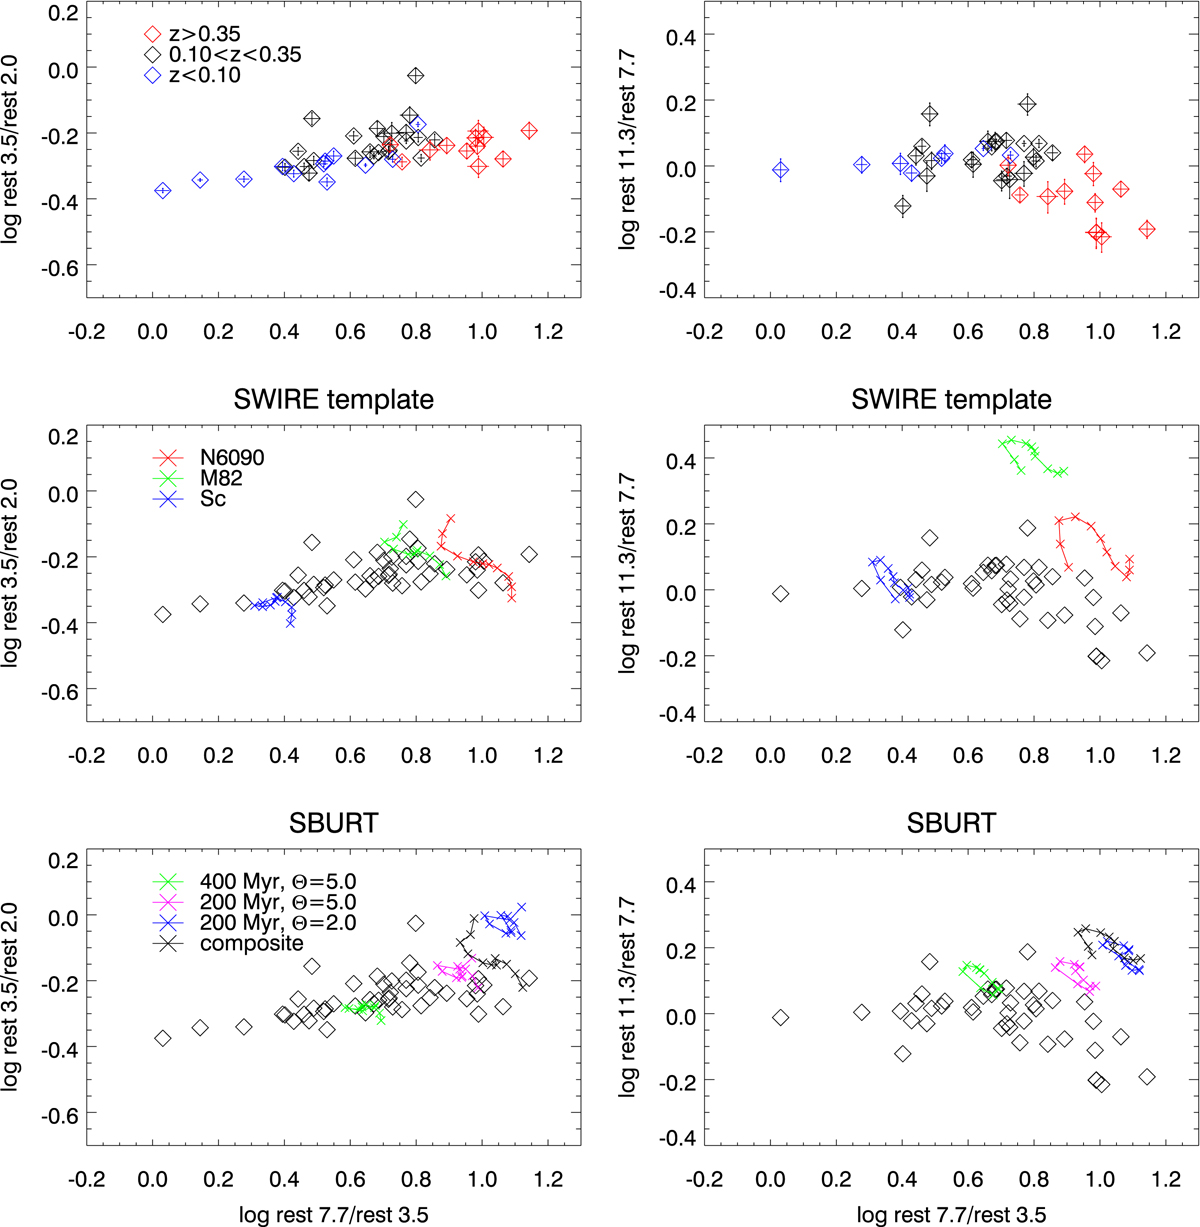
Rest-frame flux ratio diagrams between Frest 7.7 μm/Frest 3.5 μm and Frest 3.5 μm/Frest 2.0 μm (left) and between Frest 7.7 μm/Frest 3.5 μm and Frest 11.3 μm/Frest 7.7 μm (right). The flux ratios of the observations are shown with diamonds, and ones of the templates and the models are shown with connected crosses. Top: PAH galaxies in the nearby, mid-z, and higher-z redshift bins in blue, black, and red, respectively, with one-sigma error bars. Middle: SWIRE SED templates of Sc (blue), M 82 (green), and NGC 6090 (magenta) at z = 0.0–0.5 in steps of 0.05. Bottom: SBURT models of (tburst, Θ) = (400 Myr, 5.0), (200 Myr, 5.0), and (200 Myr, 2.0), and the composite model in green, magenta, blue, and black, respectively. We caution that small changes of the flux ratios of the templates and the models are not to predict real changes of the ratios as a function of redshift, but to demonstrate an accuracy of our analysis method (Sect. 3.4).
Current usage metrics show cumulative count of Article Views (full-text article views including HTML views, PDF and ePub downloads, according to the available data) and Abstracts Views on Vision4Press platform.
Data correspond to usage on the plateform after 2015. The current usage metrics is available 48-96 hours after online publication and is updated daily on week days.
Initial download of the metrics may take a while.