Fig. 2.
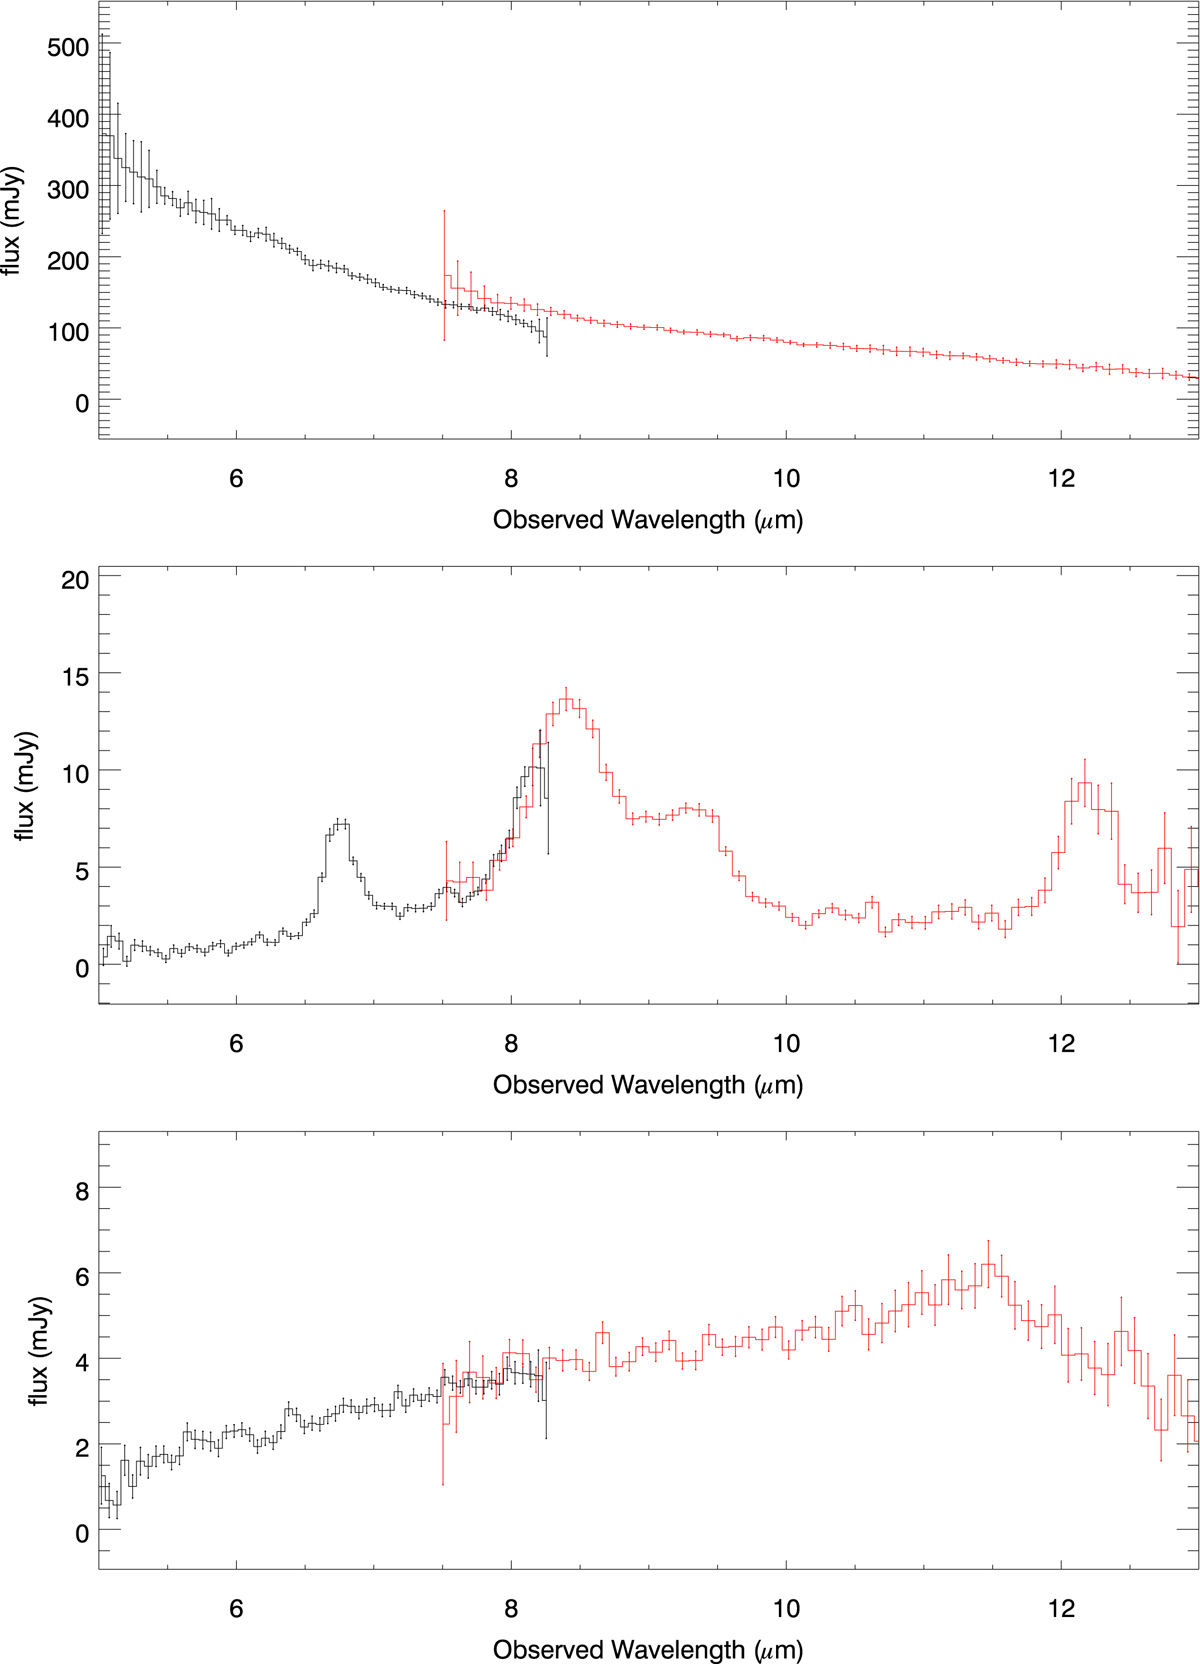
Examples of the SPICY spectra of three representative types of bright sources. The SG1 (black) and SG2 (red) spectra are shown separately. The error bars are for one sigma. Top: field star. Middle: galaxy with prominent PAH 6.2, 7.7, 8.6, and 11.3 μm features (F04-0 at zPAH = 0.087 ± 0.001; see also Fig. B.1). Bottom: AGN candidate with a red featureless continuum and possibly a deep silicate 9.7 μm absorption redshifted to ≃14 μm (F05-1 at zopt. spec = 0.4508; see Sect. 3.2.1). Slight flux offset of the star spectrum within the overlapping wavelength range of the SG1 and SG2 spectra (7.5–8.2 μm) is due to slight systematic flux calibration error caused by errors in aligning the SG1 and SG2 spectral images. Increased noise level at ≳ 12.0 μm in the middle panel is caused by partial truncation of the SG2 spectrum.
Current usage metrics show cumulative count of Article Views (full-text article views including HTML views, PDF and ePub downloads, according to the available data) and Abstracts Views on Vision4Press platform.
Data correspond to usage on the plateform after 2015. The current usage metrics is available 48-96 hours after online publication and is updated daily on week days.
Initial download of the metrics may take a while.