Fig. 18.
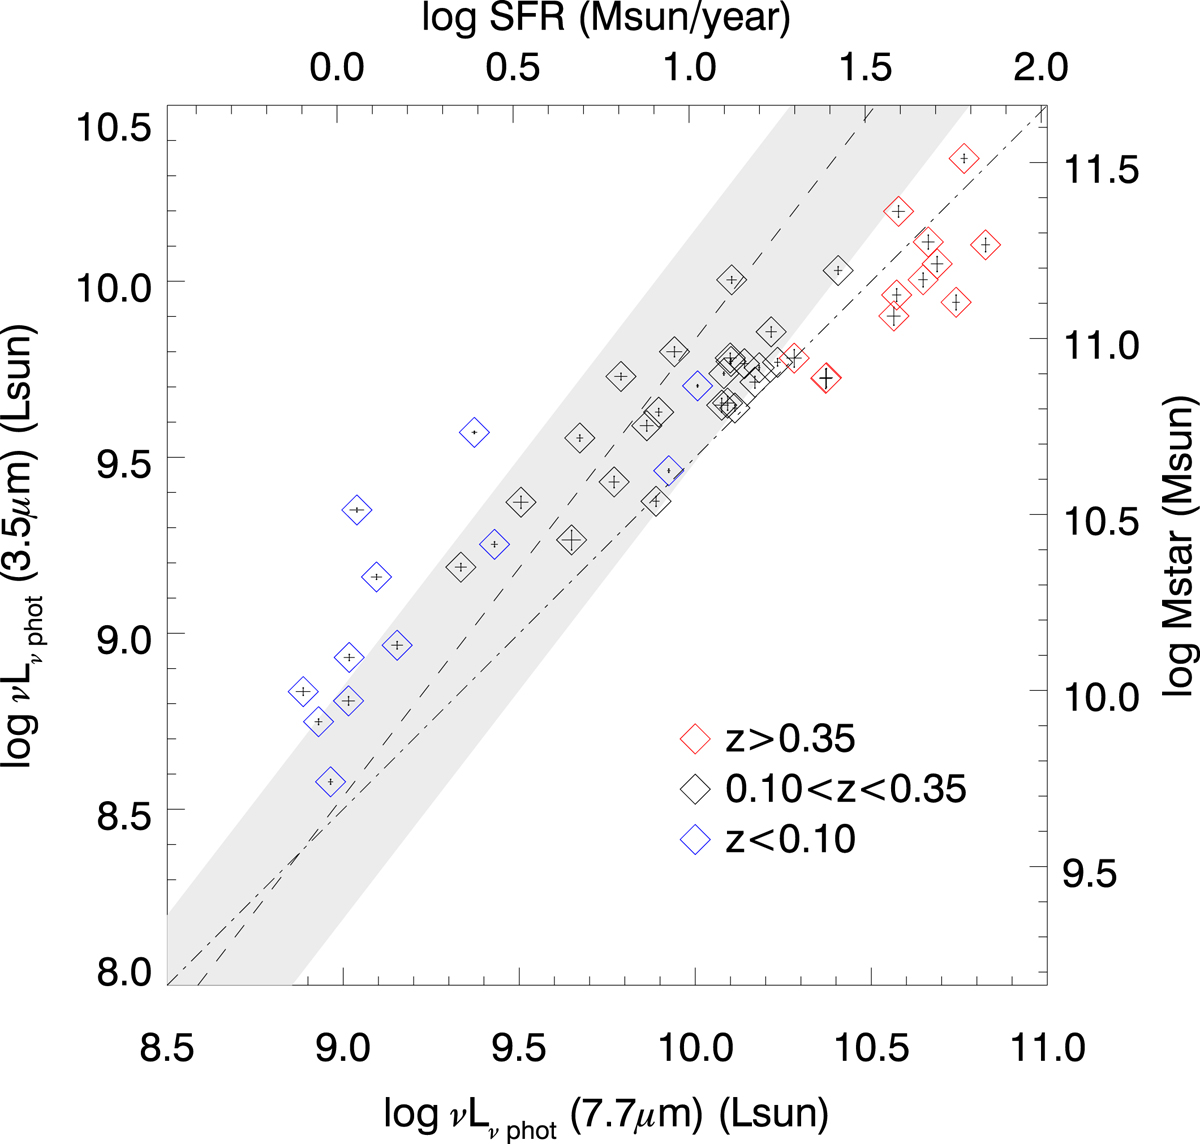
Comparison between the photometric monochromatic luminosities at 7.7 μm, νLν photo (7.7 μm), and at 3.5 μm, νLν photo (3.5 μm). The PAH galaxies are shown with one-sigma error bars in different colours for different redshift bins: blue, black, and red for the nearby, mid-z, and higher-z galaxies, respectively. SFR and stellar mass are estimated from νLν photo (7.7 μm) and νLν photo (3.5 μm), respectively, as explained in the text. A correlation between stellar mass and SFR for main sequence galaxies for z ∼ 0 SDSS sample (Elbaz et al. 2007) is indicated by a grey hatched area, showing one-sigma scatter around the best fit line (broken line). A diagonal dot-broken line for a fixed PAH-to-stellar luminosity ratio (log νLν photo (7.7 μm) = 0.50 + log νLν photo (3.5 μm)) is used to identify the PAH-enhanced population (on the lower right side of this line).
Current usage metrics show cumulative count of Article Views (full-text article views including HTML views, PDF and ePub downloads, according to the available data) and Abstracts Views on Vision4Press platform.
Data correspond to usage on the plateform after 2015. The current usage metrics is available 48-96 hours after online publication and is updated daily on week days.
Initial download of the metrics may take a while.