Fig. 16.
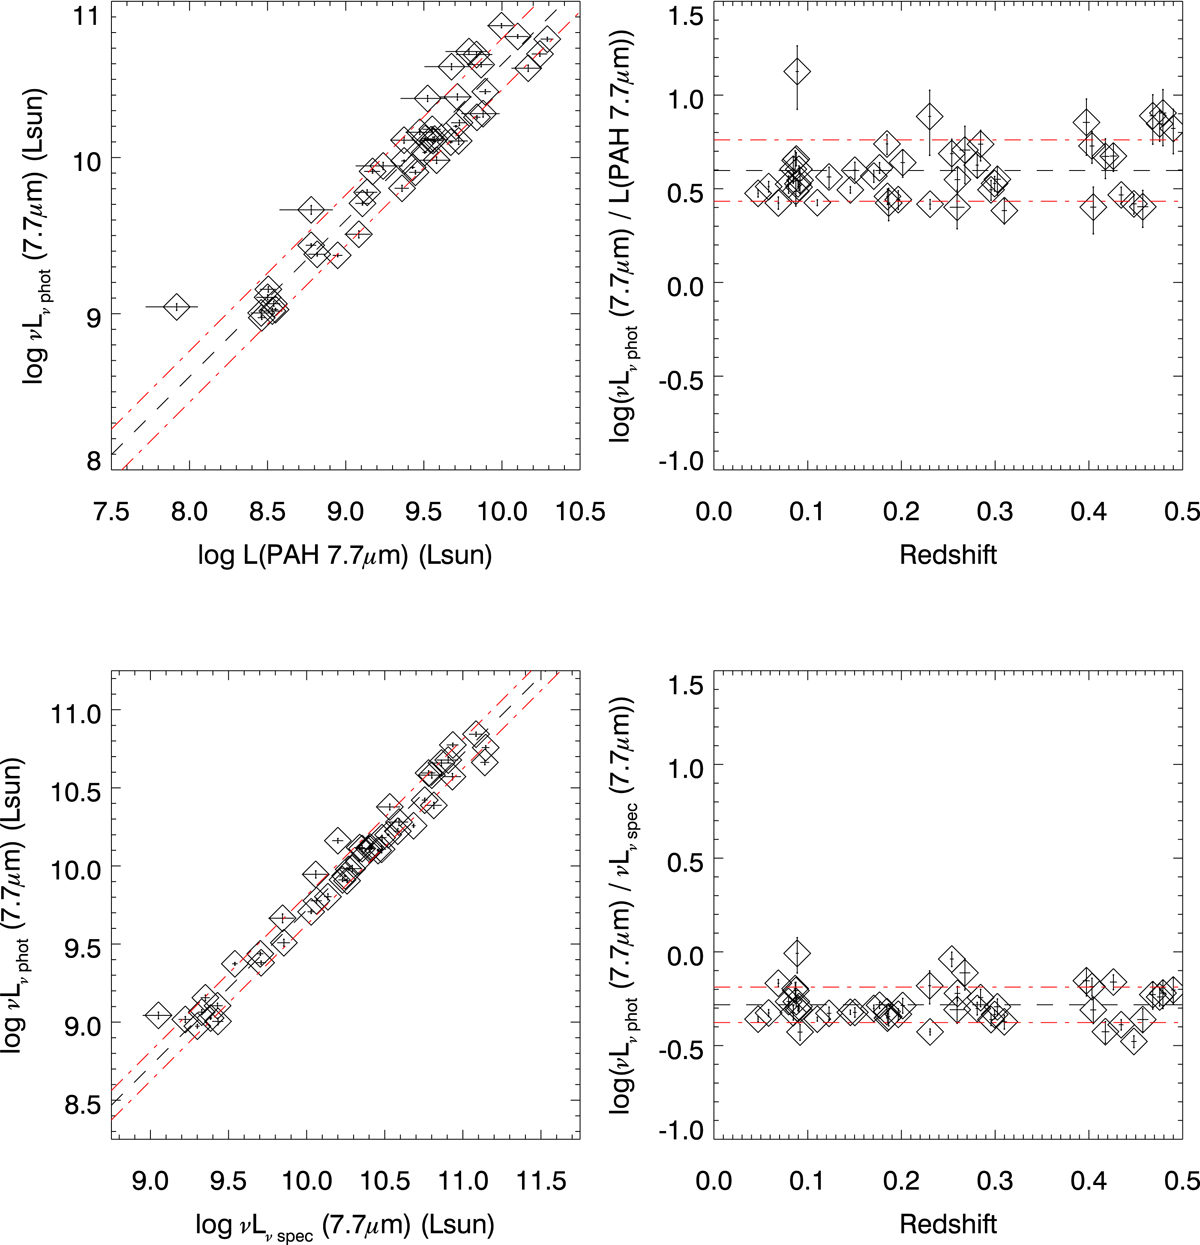
Comparisons between the spectroscopic and photometric PAH 7.7 μm luminosities of the PAH galaxies. The photometric monochromatic luminosity at 7.7 μm, νLν photo (7.7 μm), is compared with the spectroscopic PAH 7.7 μm luminosity, LPAH (7.7 μm) (top), and with the spectroscopic monochromatic luminosity at 7.7 μm, νLν spec (7.7 μm) (bottom). Their luminosity ratios are plotted as a function of redshift in the right panels. Error bars are for one sigma. In all panels, black broken lines represent the best-fit linear functions with fixed unity slopes, and red dot-broken lines indicate the one-sigma scatters.
Current usage metrics show cumulative count of Article Views (full-text article views including HTML views, PDF and ePub downloads, according to the available data) and Abstracts Views on Vision4Press platform.
Data correspond to usage on the plateform after 2015. The current usage metrics is available 48-96 hours after online publication and is updated daily on week days.
Initial download of the metrics may take a while.