Free Access
Fig. 15.
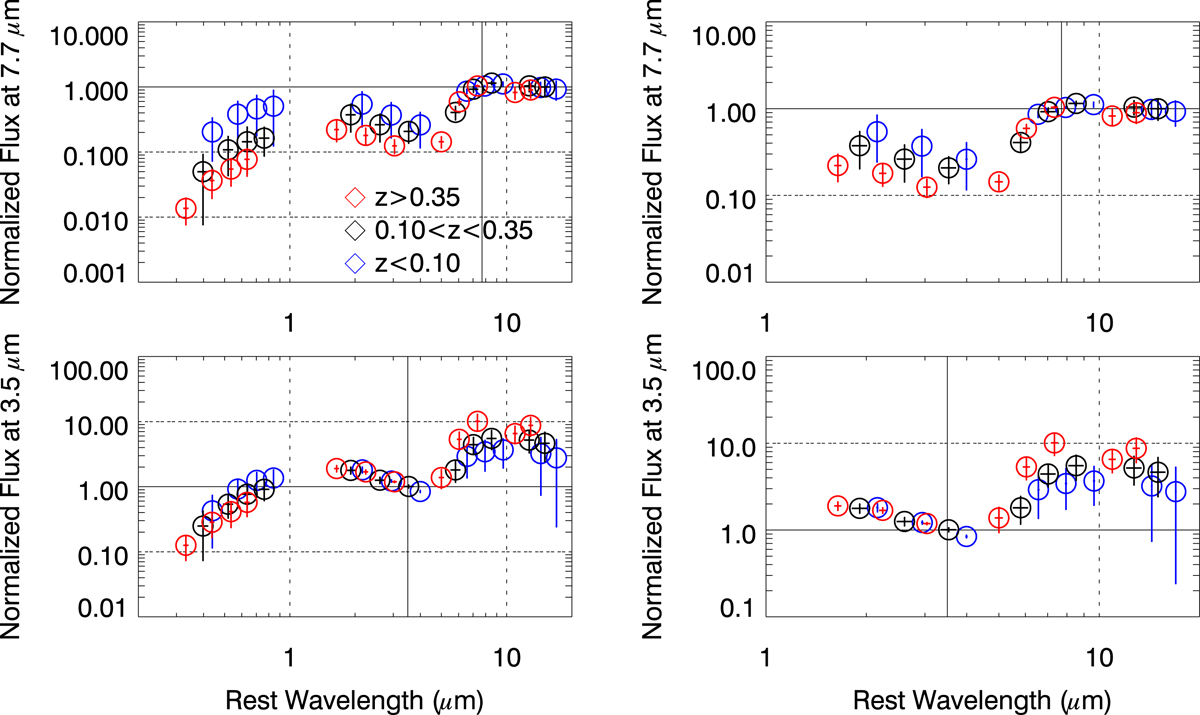
Same SED plots as Fig. 14, but for median-averaged ones (see text). Error bars represent one-sigma scatter of the normalised photometric data along both the flux and wavelength directions around the medians.
Current usage metrics show cumulative count of Article Views (full-text article views including HTML views, PDF and ePub downloads, according to the available data) and Abstracts Views on Vision4Press platform.
Data correspond to usage on the plateform after 2015. The current usage metrics is available 48-96 hours after online publication and is updated daily on week days.
Initial download of the metrics may take a while.