Fig. 11.
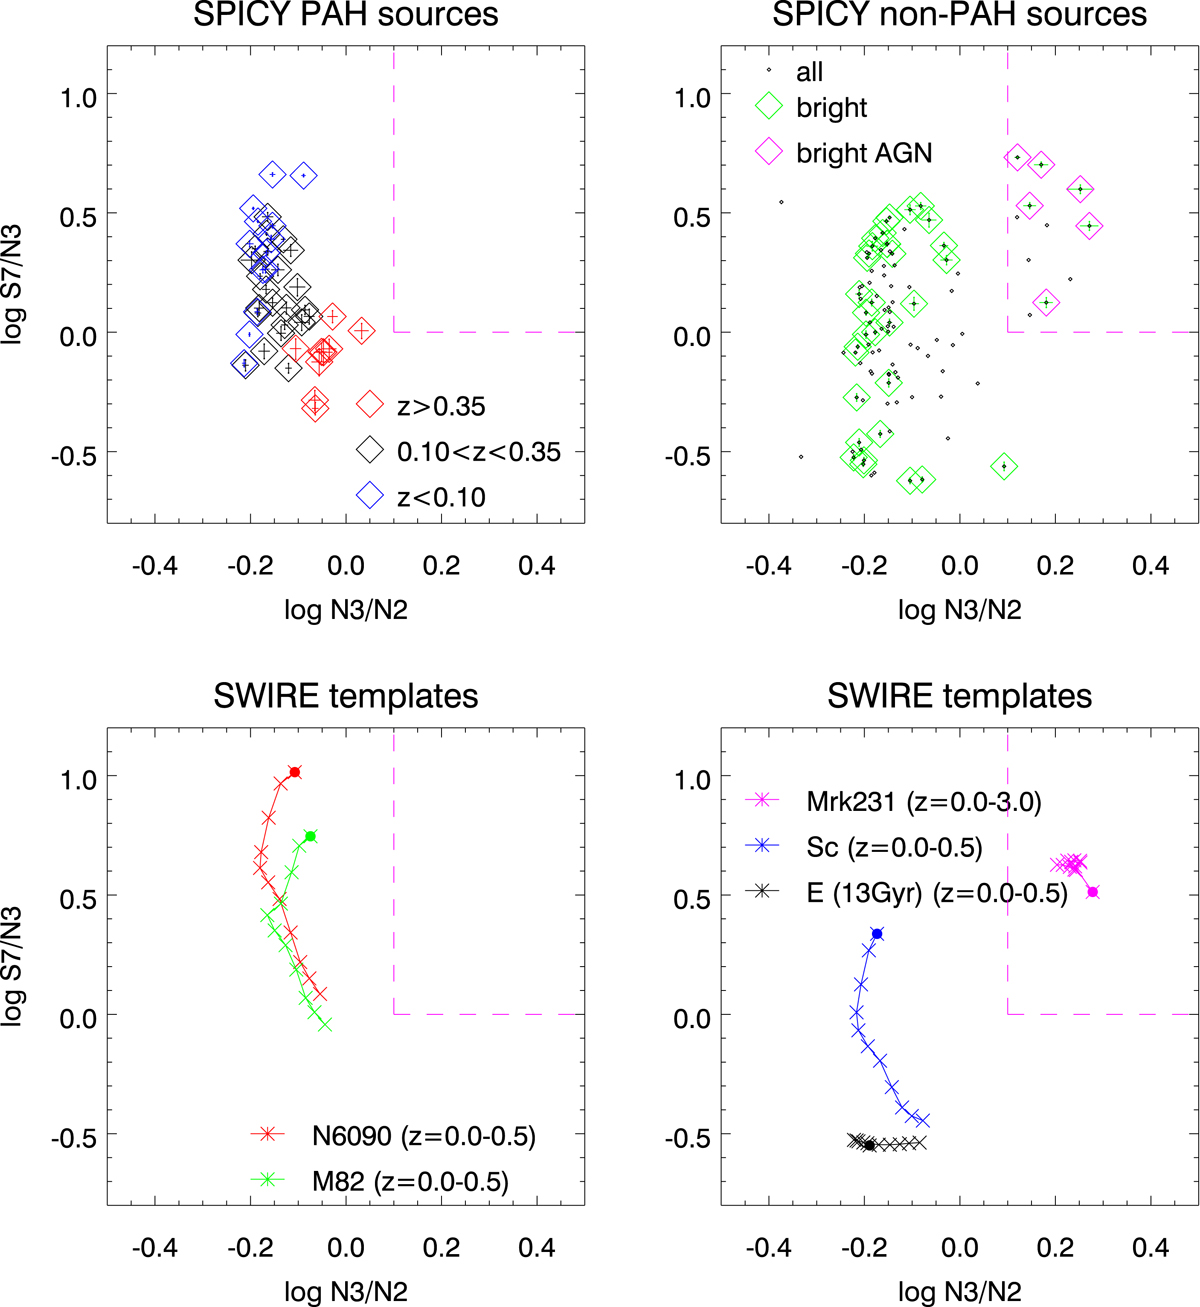
Flux ratio diagrams of log N3 (3.2 μm)/N2 (2.4 μm) and log S7 (7.0 μm)/N3 (3.2 μm) of the SPICY sources. Top left: flux ratios of the PAH sources shown with one-sigma error bars in blue, black, and red diamonds for the nearby, mid-z, and higher-z sources, respectively. Top right: same diagram as the top left panel, but for non-PAH sources (black). Bright non-PAH sources are shown with one-sigma error bars and diamonds (green). For the faint non-PAH sources, error bars are omitted for clarify of the figure. Bottom: same diagrams as the top panels, but for redshifted SWIRE NGC 6090, M 82 (left panel), Sc, E (13 Gyr old), and AGN (Mrk 231) (right panel) templates with red, green, blue, black, and magenta connected crosses, respectively. The flux ratios of the AGN template are plotted at z = 0.0–3.0 in steps of 0.5, whereas those of other templates are plotted at z = 0.0–0.5 in steps of 0.05. The flux ratios of the templates at z = 0.0 are indicated by filled circles in both bottom panels. A space of the flux ratios to identify photometric AGN candidates (see text for the definition) is outlined by magenta dashed lines in all panels. Bright photometric AGN candidates are shown with magenta diamonds in the top right panel.
Current usage metrics show cumulative count of Article Views (full-text article views including HTML views, PDF and ePub downloads, according to the available data) and Abstracts Views on Vision4Press platform.
Data correspond to usage on the plateform after 2015. The current usage metrics is available 48-96 hours after online publication and is updated daily on week days.
Initial download of the metrics may take a while.