Fig. 9.
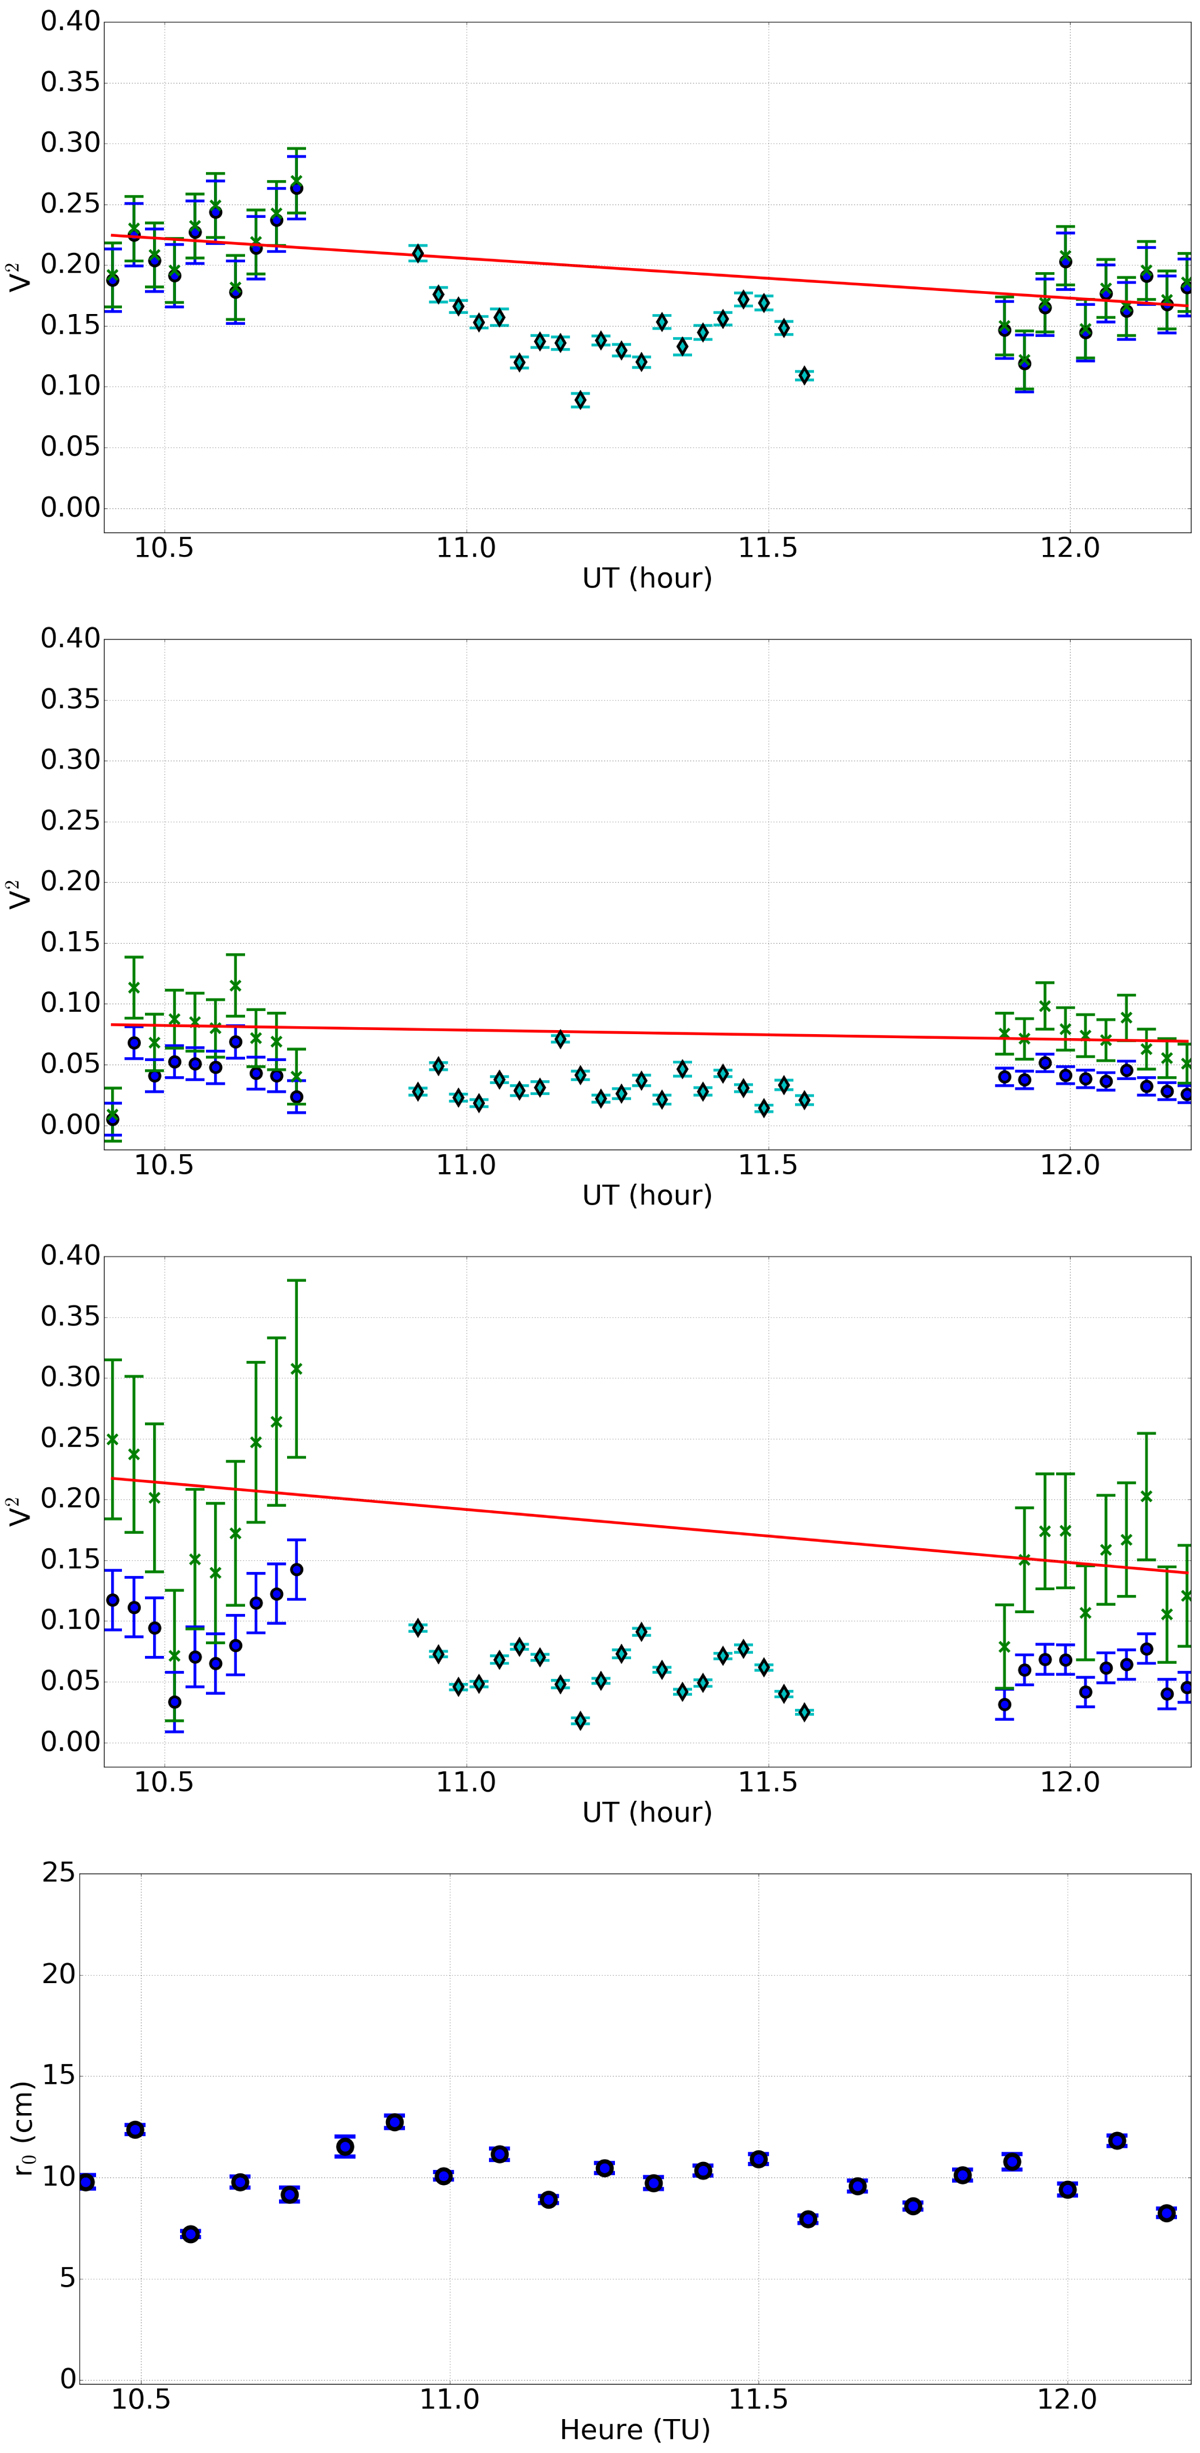
Squared visibilities on ζ Ori A versus time during the night of 2017 Oct 12. From top to bottom panels: baselines S2S1, S2W2, and S1W2 for the reference star κ Ori (blue dots), the target ζ Ori A (cyan diamonds), the squared instrumental visibilities ![]() (green crosses), and the transfer function
(green crosses), and the transfer function ![]() obtained from a linear adjustment (red curve). The last plot is the evolution of the r0 during the observation.
obtained from a linear adjustment (red curve). The last plot is the evolution of the r0 during the observation.
Current usage metrics show cumulative count of Article Views (full-text article views including HTML views, PDF and ePub downloads, according to the available data) and Abstracts Views on Vision4Press platform.
Data correspond to usage on the plateform after 2015. The current usage metrics is available 48-96 hours after online publication and is updated daily on week days.
Initial download of the metrics may take a while.