Fig. 8.
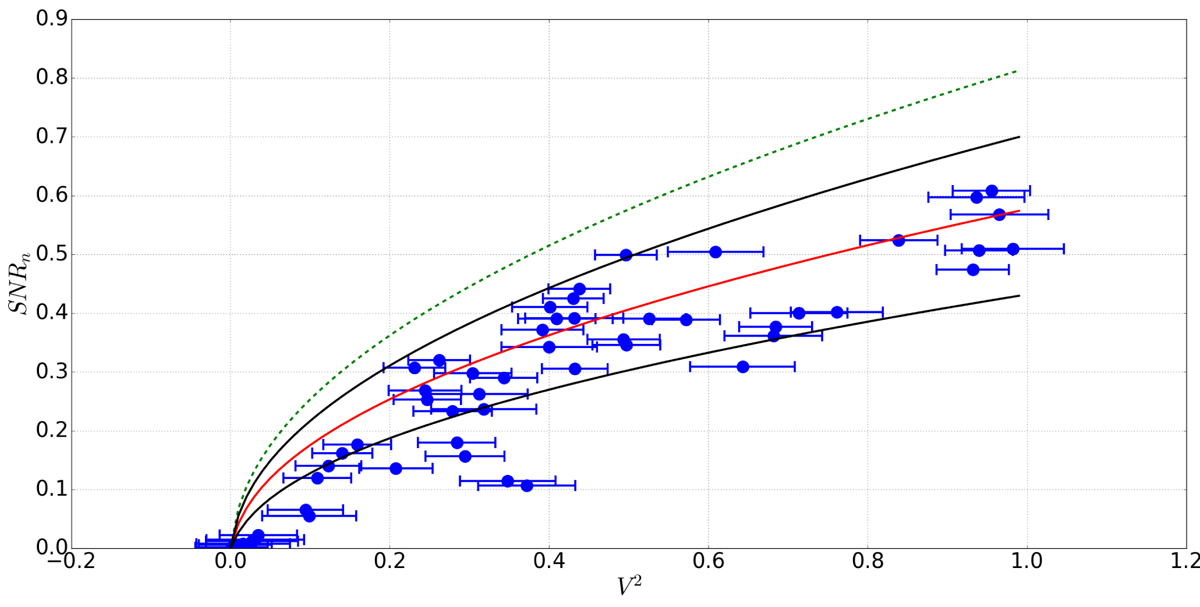
Normalized S/N of the V2 measurements versus V2 for the observation of HD 3360 of 2016 Sep 30 (blue dots) and our model of S/N estimation considering the mean Strehl ratio (3.5%, red solid curve), the worst one (2.6%, lower black solid curve), the best one (4.3%, upper black solid curve) and without the amplification noise (green dashed curve). The last case is obtained with the mean Strehl ratio.
Current usage metrics show cumulative count of Article Views (full-text article views including HTML views, PDF and ePub downloads, according to the available data) and Abstracts Views on Vision4Press platform.
Data correspond to usage on the plateform after 2015. The current usage metrics is available 48-96 hours after online publication and is updated daily on week days.
Initial download of the metrics may take a while.