Fig. 7.
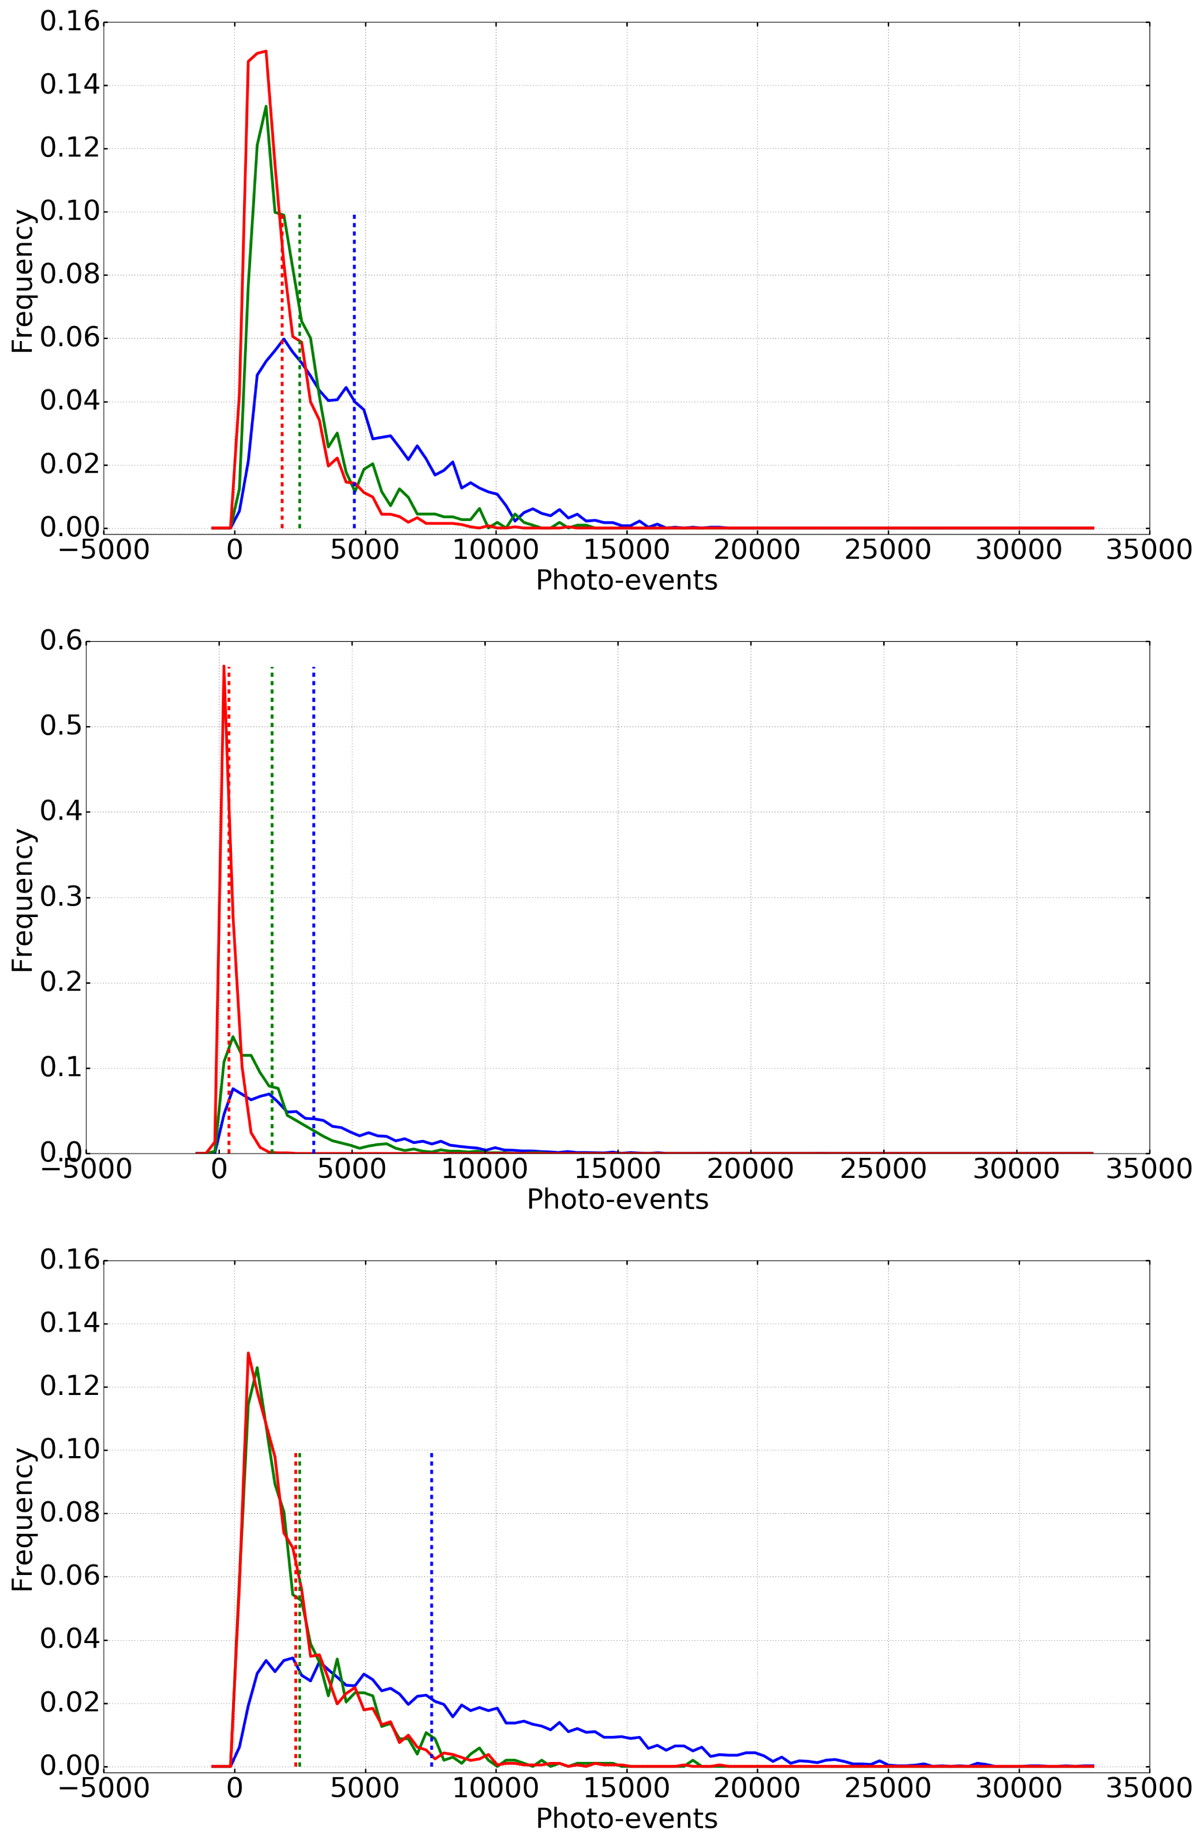
Distribution of the injected photo-events per frame for S2 (top panel), S1 (middle panel), W2 (bottom panel) telescope. The blue (resp. green, red) solid line is the distribution of photon-events per frame in closed loop (resp. open loop, flatten) mode and the blue (resp. green, red) dashed line represents the corresponding average number of photo-events per frame.
Current usage metrics show cumulative count of Article Views (full-text article views including HTML views, PDF and ePub downloads, according to the available data) and Abstracts Views on Vision4Press platform.
Data correspond to usage on the plateform after 2015. The current usage metrics is available 48-96 hours after online publication and is updated daily on week days.
Initial download of the metrics may take a while.