Fig. 5.
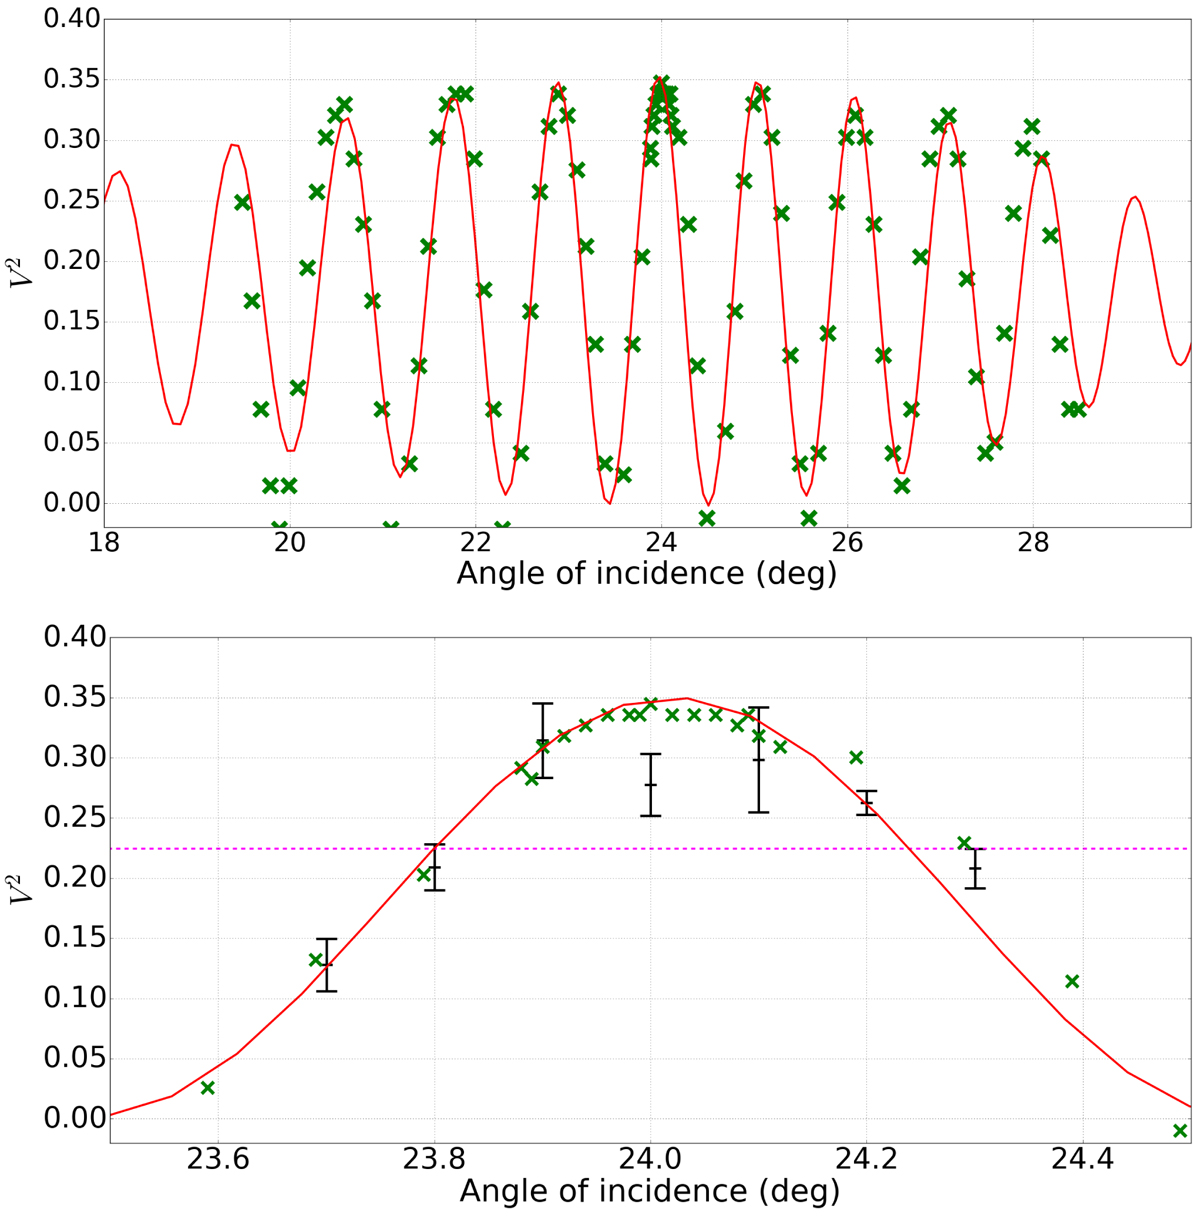
Top panel: effect of the orientation of the plate 3 on the instrumental visibility of the fringe system 2–3. The prediction by the numerical model (solid red line) is superimposed to the measurements (green crosses) made on the internal source. Bottom panel: magnification of the area around the optimal angular position of the plate. The on-sky measurements without the system of compensation of the birefringence (dashed magenta line) and with the system in place (black pluses) are plotted. Each black plus point and its error bar are respectively the average and standard deviation of a sample of five measurements from five blocks of 6000 frames.
Current usage metrics show cumulative count of Article Views (full-text article views including HTML views, PDF and ePub downloads, according to the available data) and Abstracts Views on Vision4Press platform.
Data correspond to usage on the plateform after 2015. The current usage metrics is available 48-96 hours after online publication and is updated daily on week days.
Initial download of the metrics may take a while.