Fig. A.1.
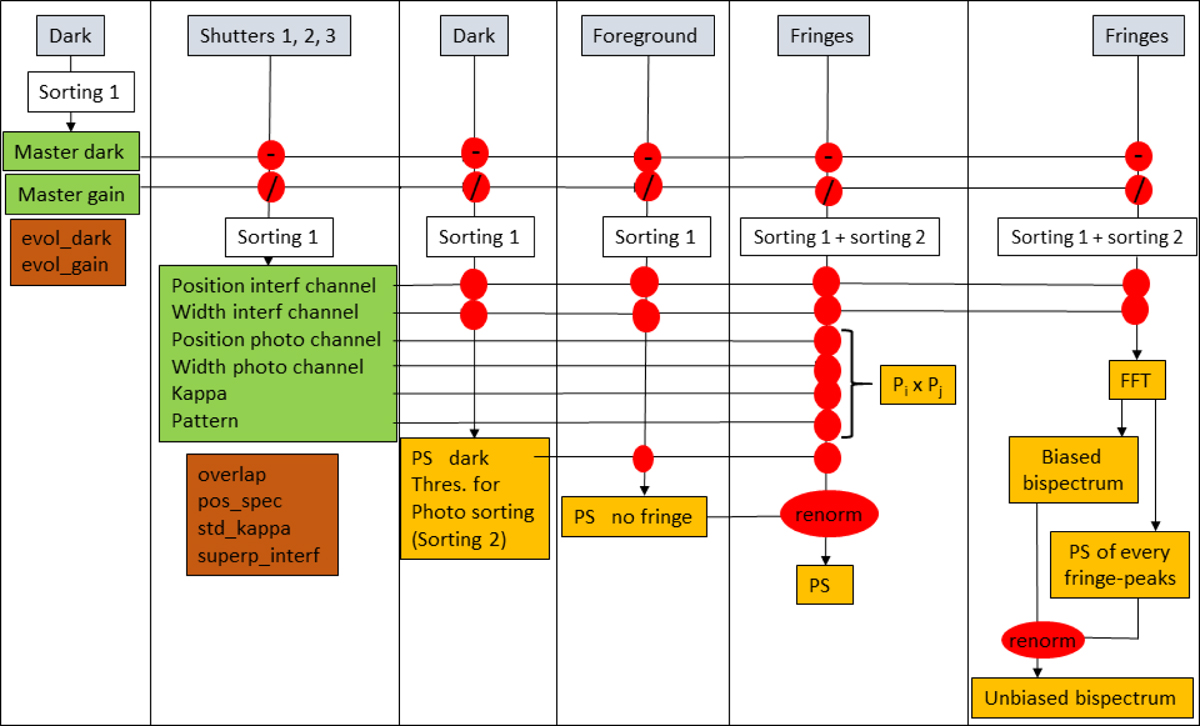
Data flow of FRIEND represented, from left to right, as the six steps explained in the text. There are the different raw data (grey boxes), the products of calibration (green boxes), the quality controls (brown boxes), and the products of the processing (orange boxes). Some products are required to proceed to the enxt step (red circles). Different selections are made on the raw frames (Sorting boxes): Sorting 1 removes the frames with flashes and Sorting 2 removes frames on photometric criteria.
Current usage metrics show cumulative count of Article Views (full-text article views including HTML views, PDF and ePub downloads, according to the available data) and Abstracts Views on Vision4Press platform.
Data correspond to usage on the plateform after 2015. The current usage metrics is available 48-96 hours after online publication and is updated daily on week days.
Initial download of the metrics may take a while.