Free Access
Fig. 11.
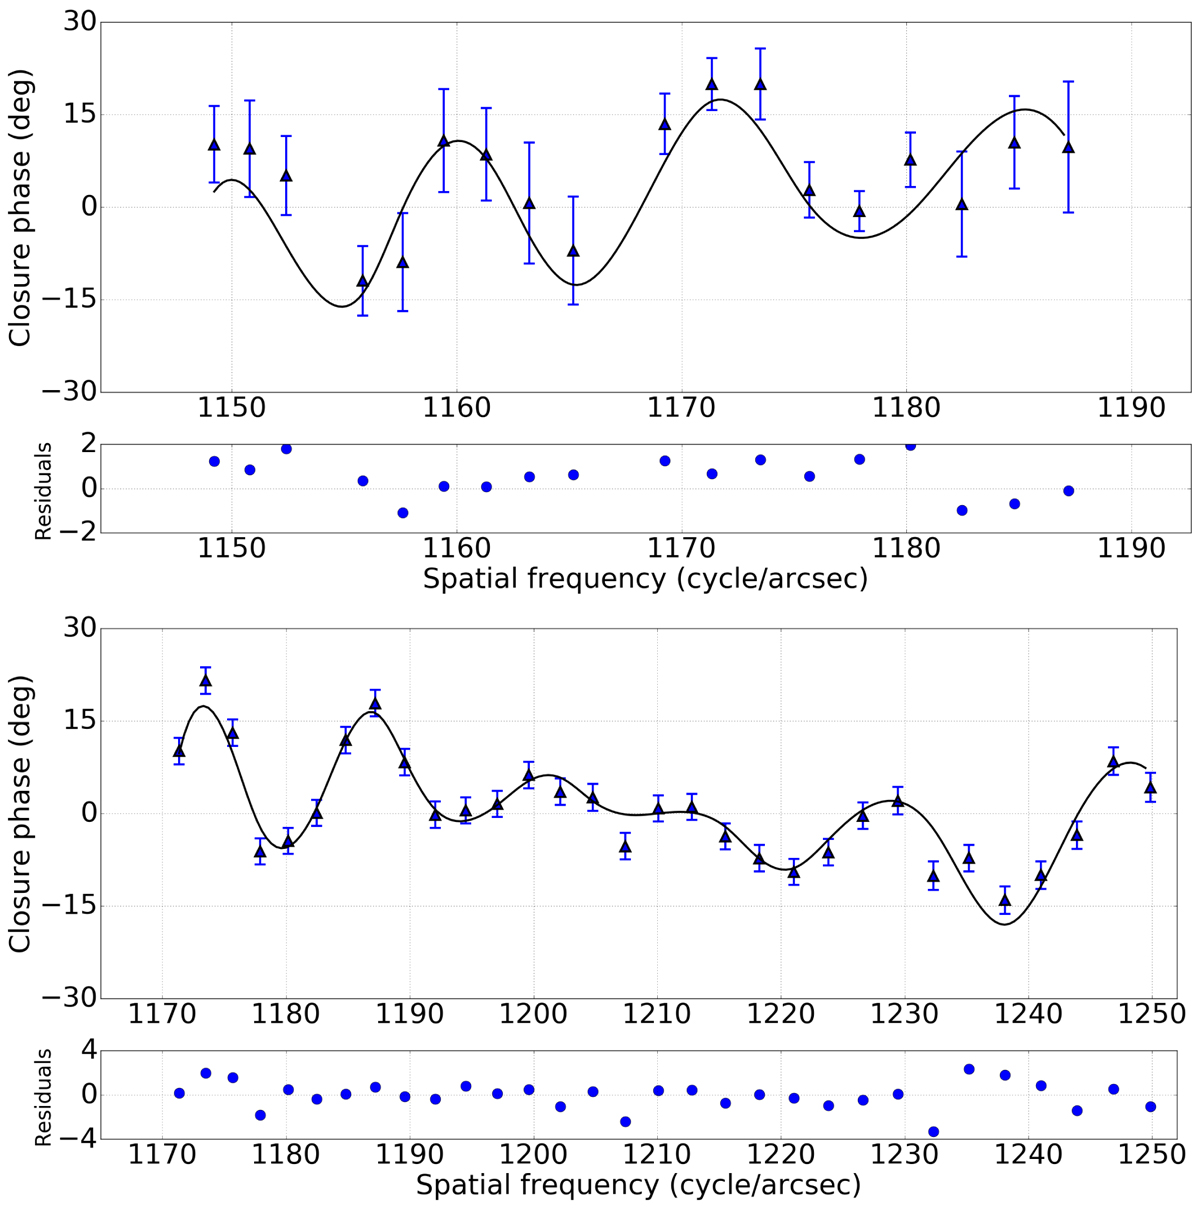
Closure phase (blue triangles) and normalized residuals of ζ Ori A (blue dots) versus spatial frequency of S1W2 with the best model (solid line). Top panel: 2017 Oct 12, bottom panel: 2017 Oct 14. The missing points at 1154 and 1167 cycles arcsec−1 on the upper plot are absurd and are removed from the model fitting.
Current usage metrics show cumulative count of Article Views (full-text article views including HTML views, PDF and ePub downloads, according to the available data) and Abstracts Views on Vision4Press platform.
Data correspond to usage on the plateform after 2015. The current usage metrics is available 48-96 hours after online publication and is updated daily on week days.
Initial download of the metrics may take a while.