Fig. 9.
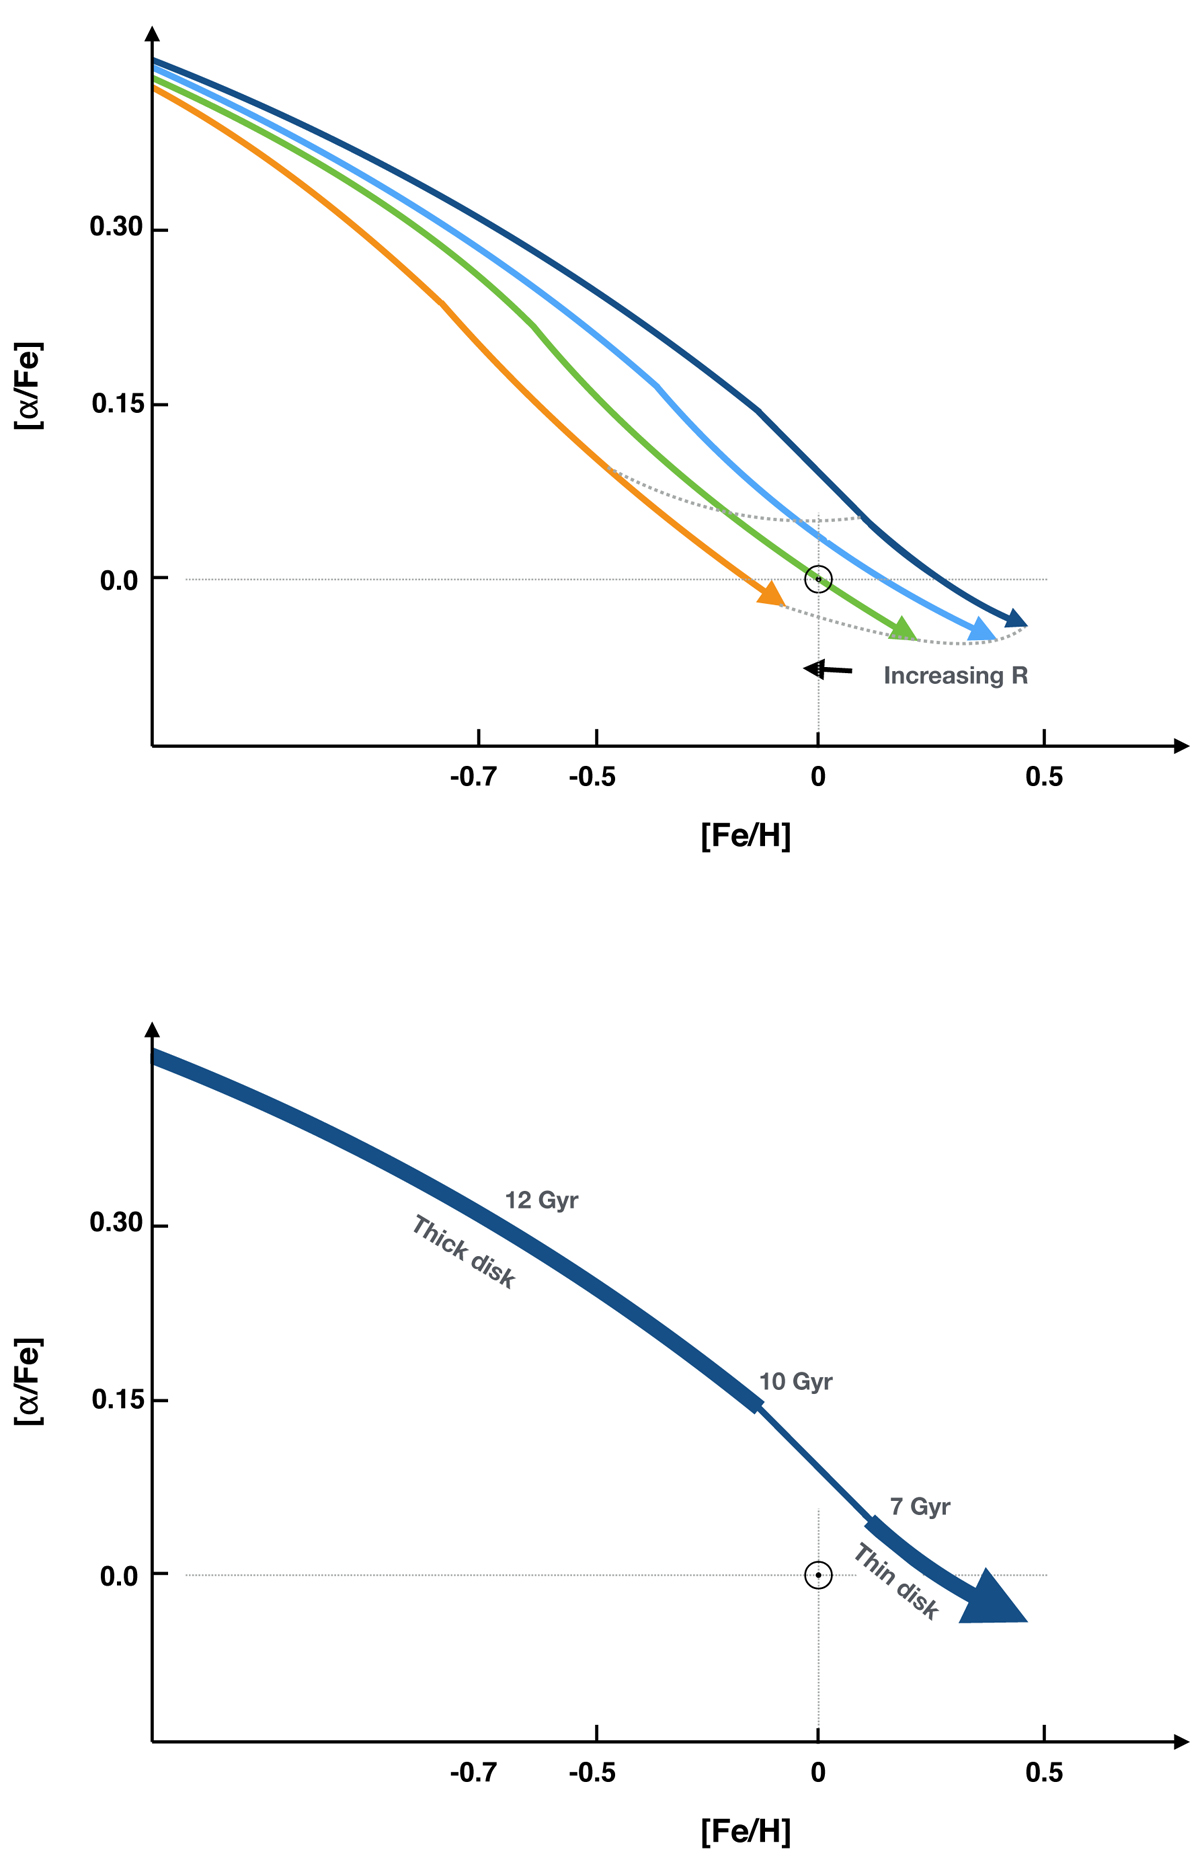
Two different illustrative sketches of the inner disk [Fe/H]-[α/Fe] distribution: in case of the inside-out scenario (top), and for the scenario presented here (bottom). We emphasize that these schemas are meant to represent the evolution of the inner disk only (not the whole disk). The position of the Sun (which, in the second scenario, does not belong to the inner disk evolution) is represented on each plot, together with indicative ages along the chemical track in the bottom plot. On this plot, the thinner segment (between 10 and 7 Gyr) corresponds to the quenching episode of star formation found in Haywood et al. (2016a). In the first scenario, a spread in metallicity and alpha abundance is expected at a given age in the inner disk.
Current usage metrics show cumulative count of Article Views (full-text article views including HTML views, PDF and ePub downloads, according to the available data) and Abstracts Views on Vision4Press platform.
Data correspond to usage on the plateform after 2015. The current usage metrics is available 48-96 hours after online publication and is updated daily on week days.
Initial download of the metrics may take a while.