Fig. 6.
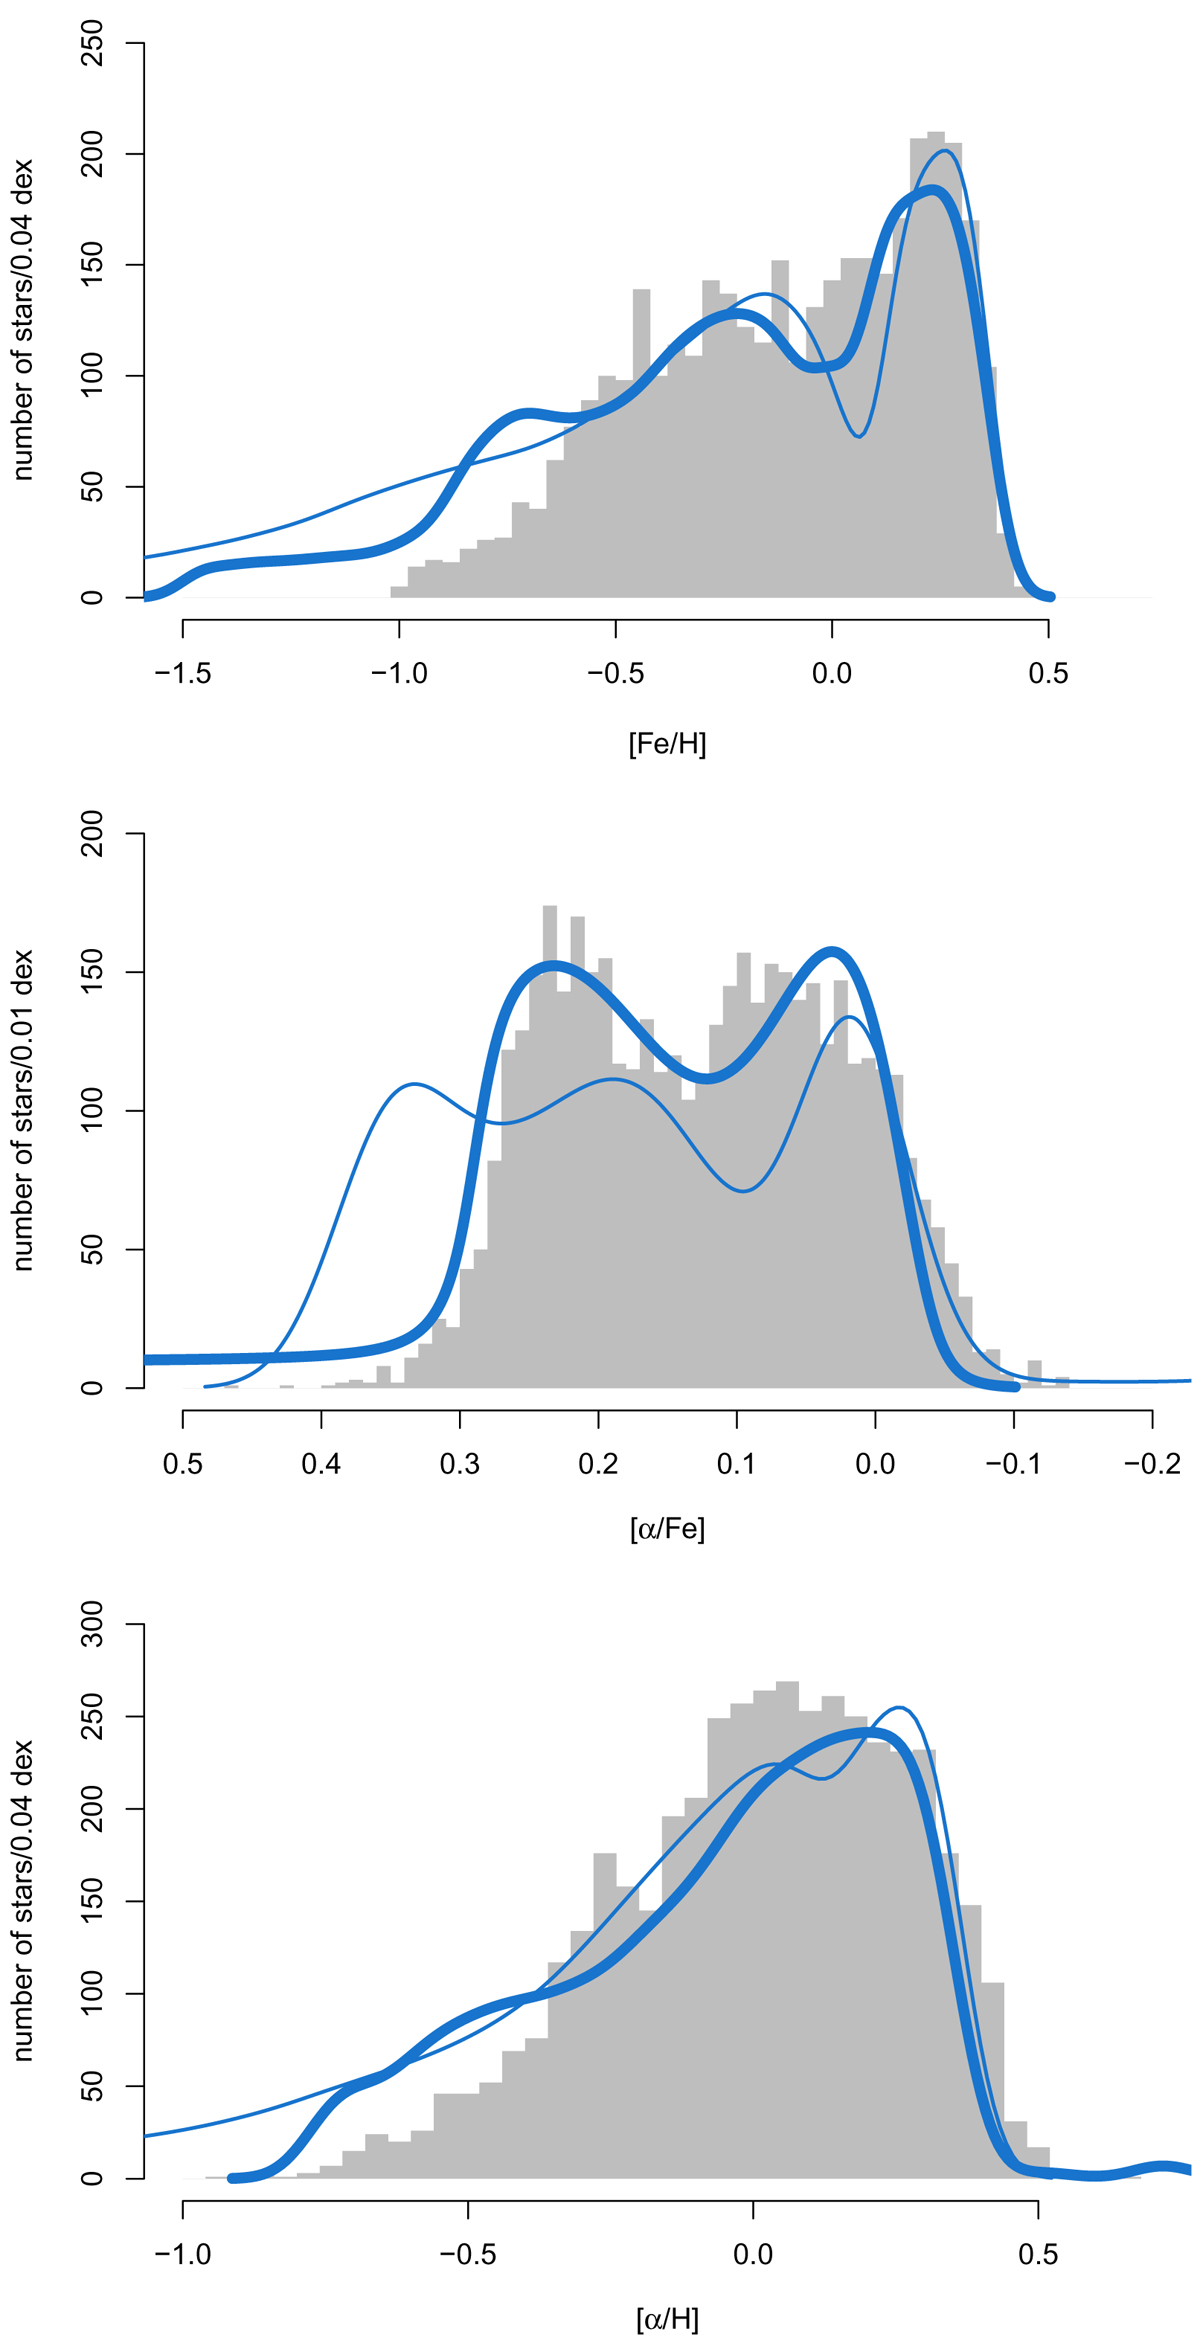
APOGEE sample of stars within 3 kpc of the Galactic center, chosen to represent the bulge population, compared with our models. The models are normalized to have the same number of stars as the data in the metallicity range [Fe/H] = −1 to +0.5 dex. Thin curve: smoothed model. Thick curve: fiducial model. Upper plot: comparison of the metallicity distributions. Middle plot: comparison of the [α/Fe] distributions. Lower plot: [α/H] distributions.
Current usage metrics show cumulative count of Article Views (full-text article views including HTML views, PDF and ePub downloads, according to the available data) and Abstracts Views on Vision4Press platform.
Data correspond to usage on the plateform after 2015. The current usage metrics is available 48-96 hours after online publication and is updated daily on week days.
Initial download of the metrics may take a while.