Fig. 2.
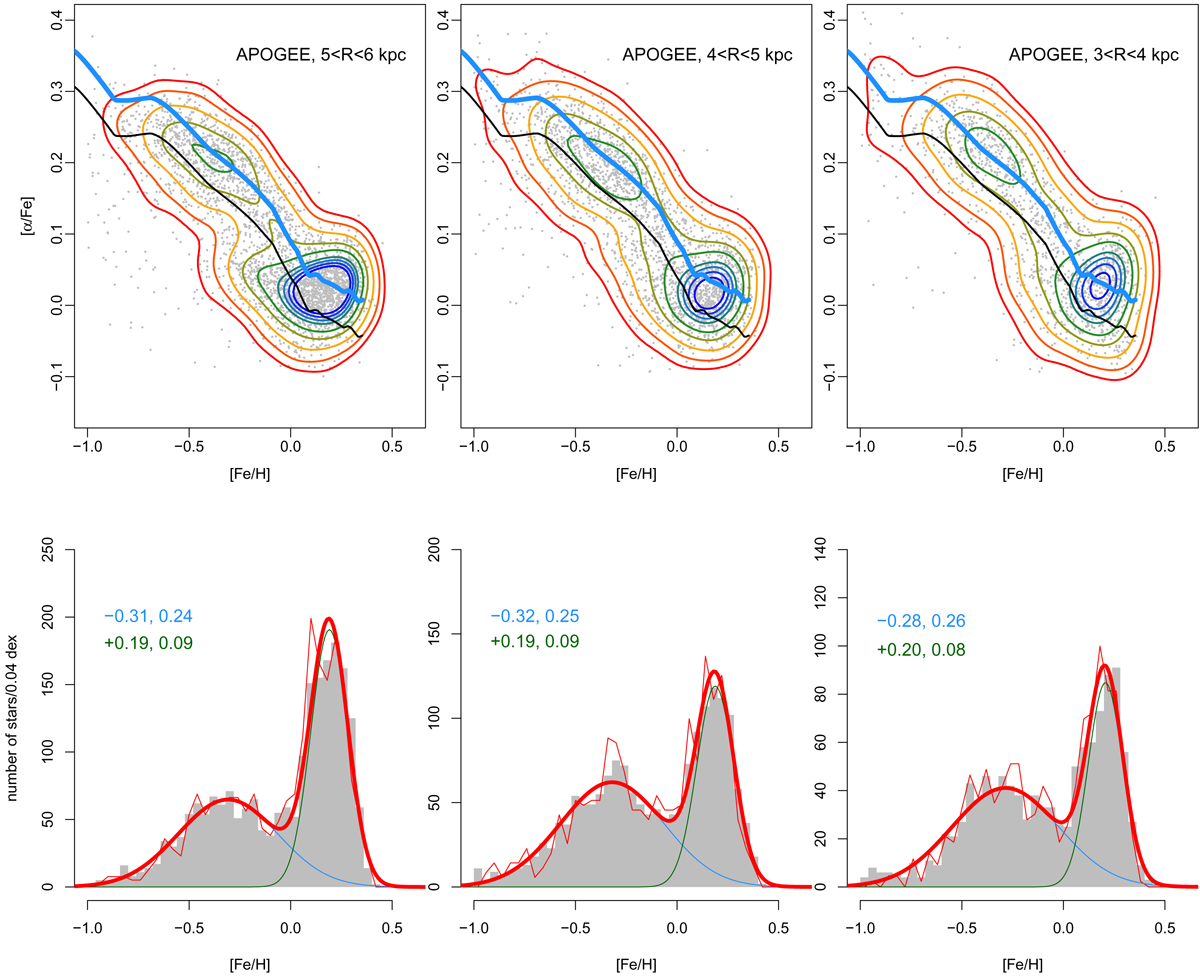
Top: [α/Fe]-[Fe/H] distribution of stars from APOGEE in different distance bins as indicated on each plot. Our standard model is shown in blue, the same model lowered by −0.05 dex in black. Stars that compose our MDFs are selected above this line. Bottom: gray histograms are MDFs of stars selected above the black line. The thick red curves are the sum of the two components (blue and green) in the finite mixture decomposition applied to the gray histograms. The mean metallicity and dispersion of each component is given on each plot. The red thin curves are the histograms obtained by selecting stars in the APOGEE catalog with a signal-to-noise ratio (S/N) above 150 (instead of 50 for the gray histogram).
Current usage metrics show cumulative count of Article Views (full-text article views including HTML views, PDF and ePub downloads, according to the available data) and Abstracts Views on Vision4Press platform.
Data correspond to usage on the plateform after 2015. The current usage metrics is available 48-96 hours after online publication and is updated daily on week days.
Initial download of the metrics may take a while.