Fig. 10.
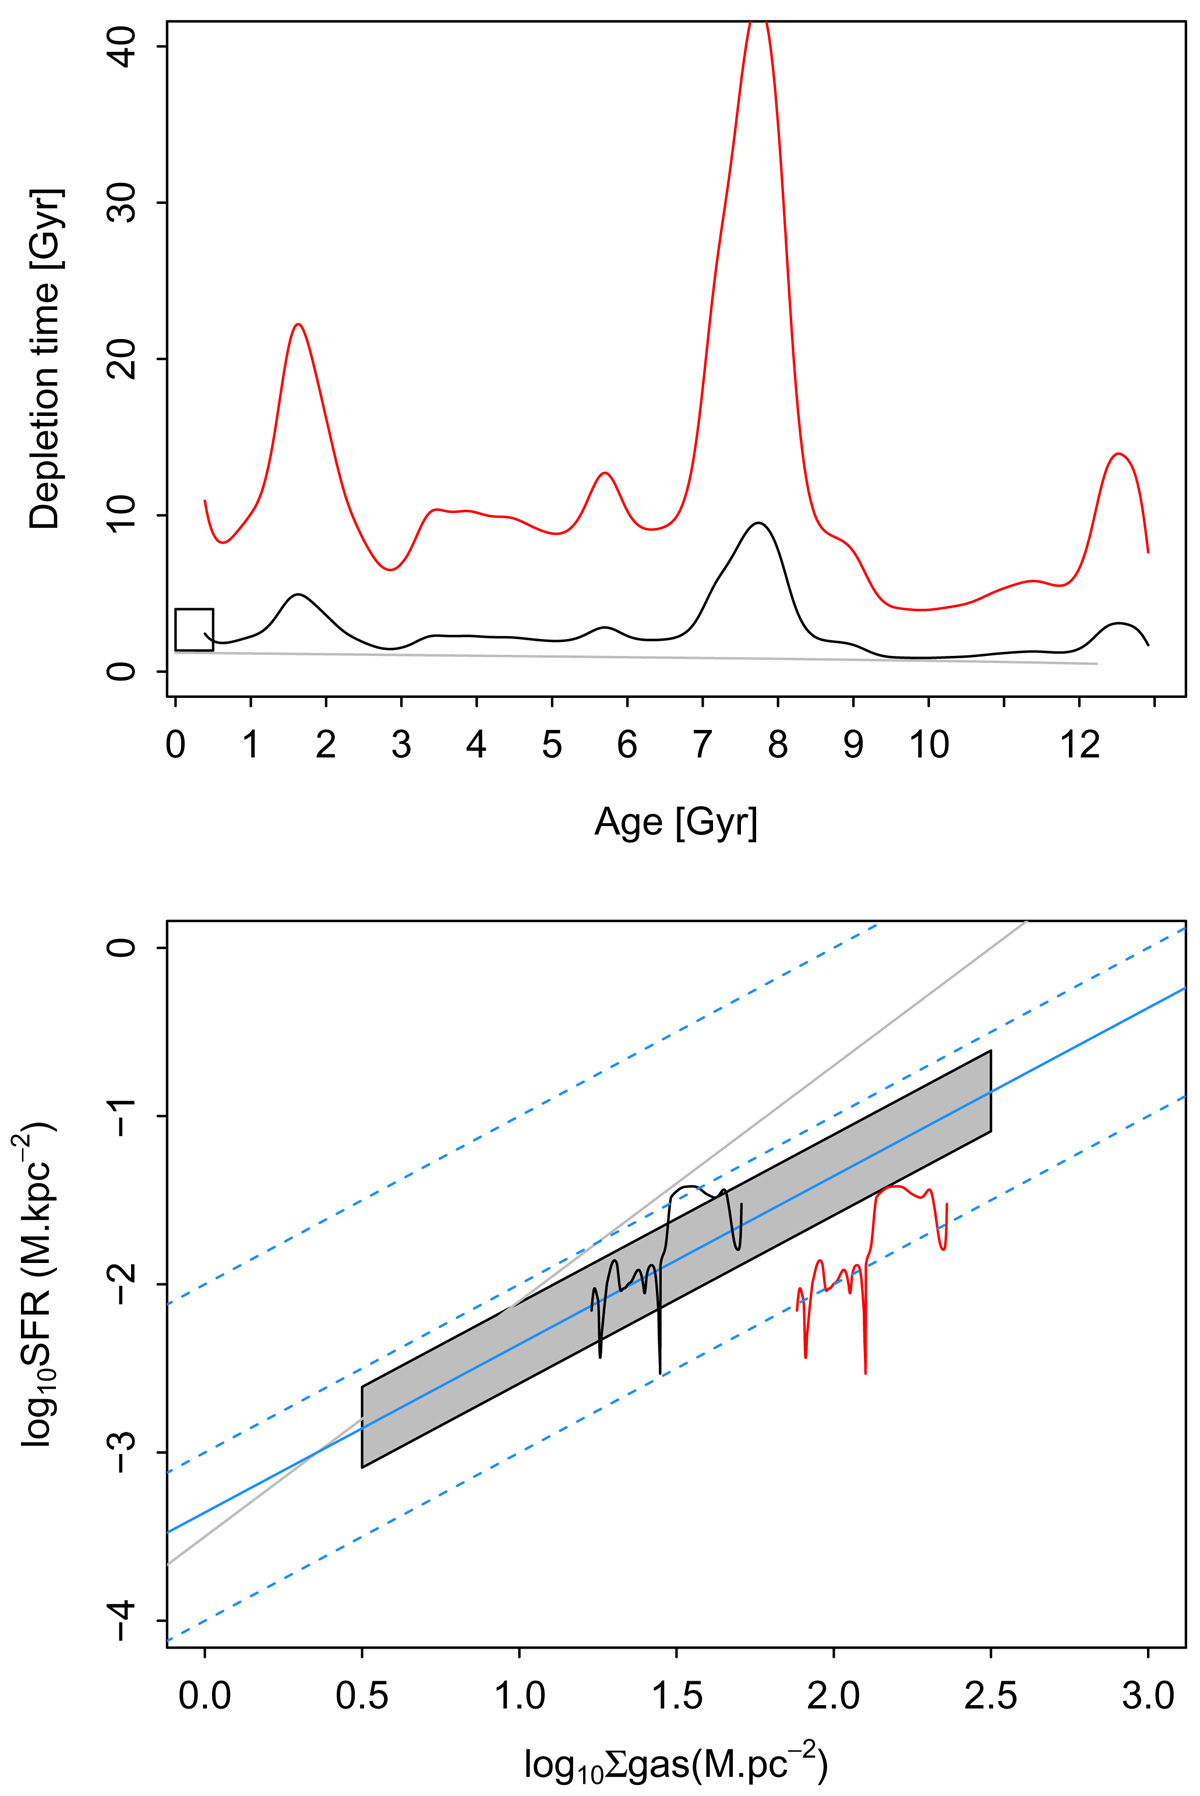
Top: red curve shows the depletion timescale of the model, assuming all the gas in the system can form stars. The black curve is the depletion timescale of the model, rescaled to have a depletion timescale at present times compatible with the value of Bigiel et al. (2011) of 2.35 Gyr (square at age = 0). This implies that at any given time, 2/9 of the gas is molecular. The peak at 7.5 Gyr corresponds to the quenching episode. The gray line is the depletion timescale of molecular gas as a function of time from Tacconi et al. (2018). Bottom: our model on the Schmidt-Kennicutt diagram, for the two cases as above. The blue line corresponds to the relation of Bigiel et al. (2011), and corresponds to a SK law with exponent n = 1. The gray area corresponds to the 1-sigma observations of Bigiel et al. (2011) for H2. The gray line is the Kennicutt law with an exponent 1.4.
Current usage metrics show cumulative count of Article Views (full-text article views including HTML views, PDF and ePub downloads, according to the available data) and Abstracts Views on Vision4Press platform.
Data correspond to usage on the plateform after 2015. The current usage metrics is available 48-96 hours after online publication and is updated daily on week days.
Initial download of the metrics may take a while.