Fig. 1.
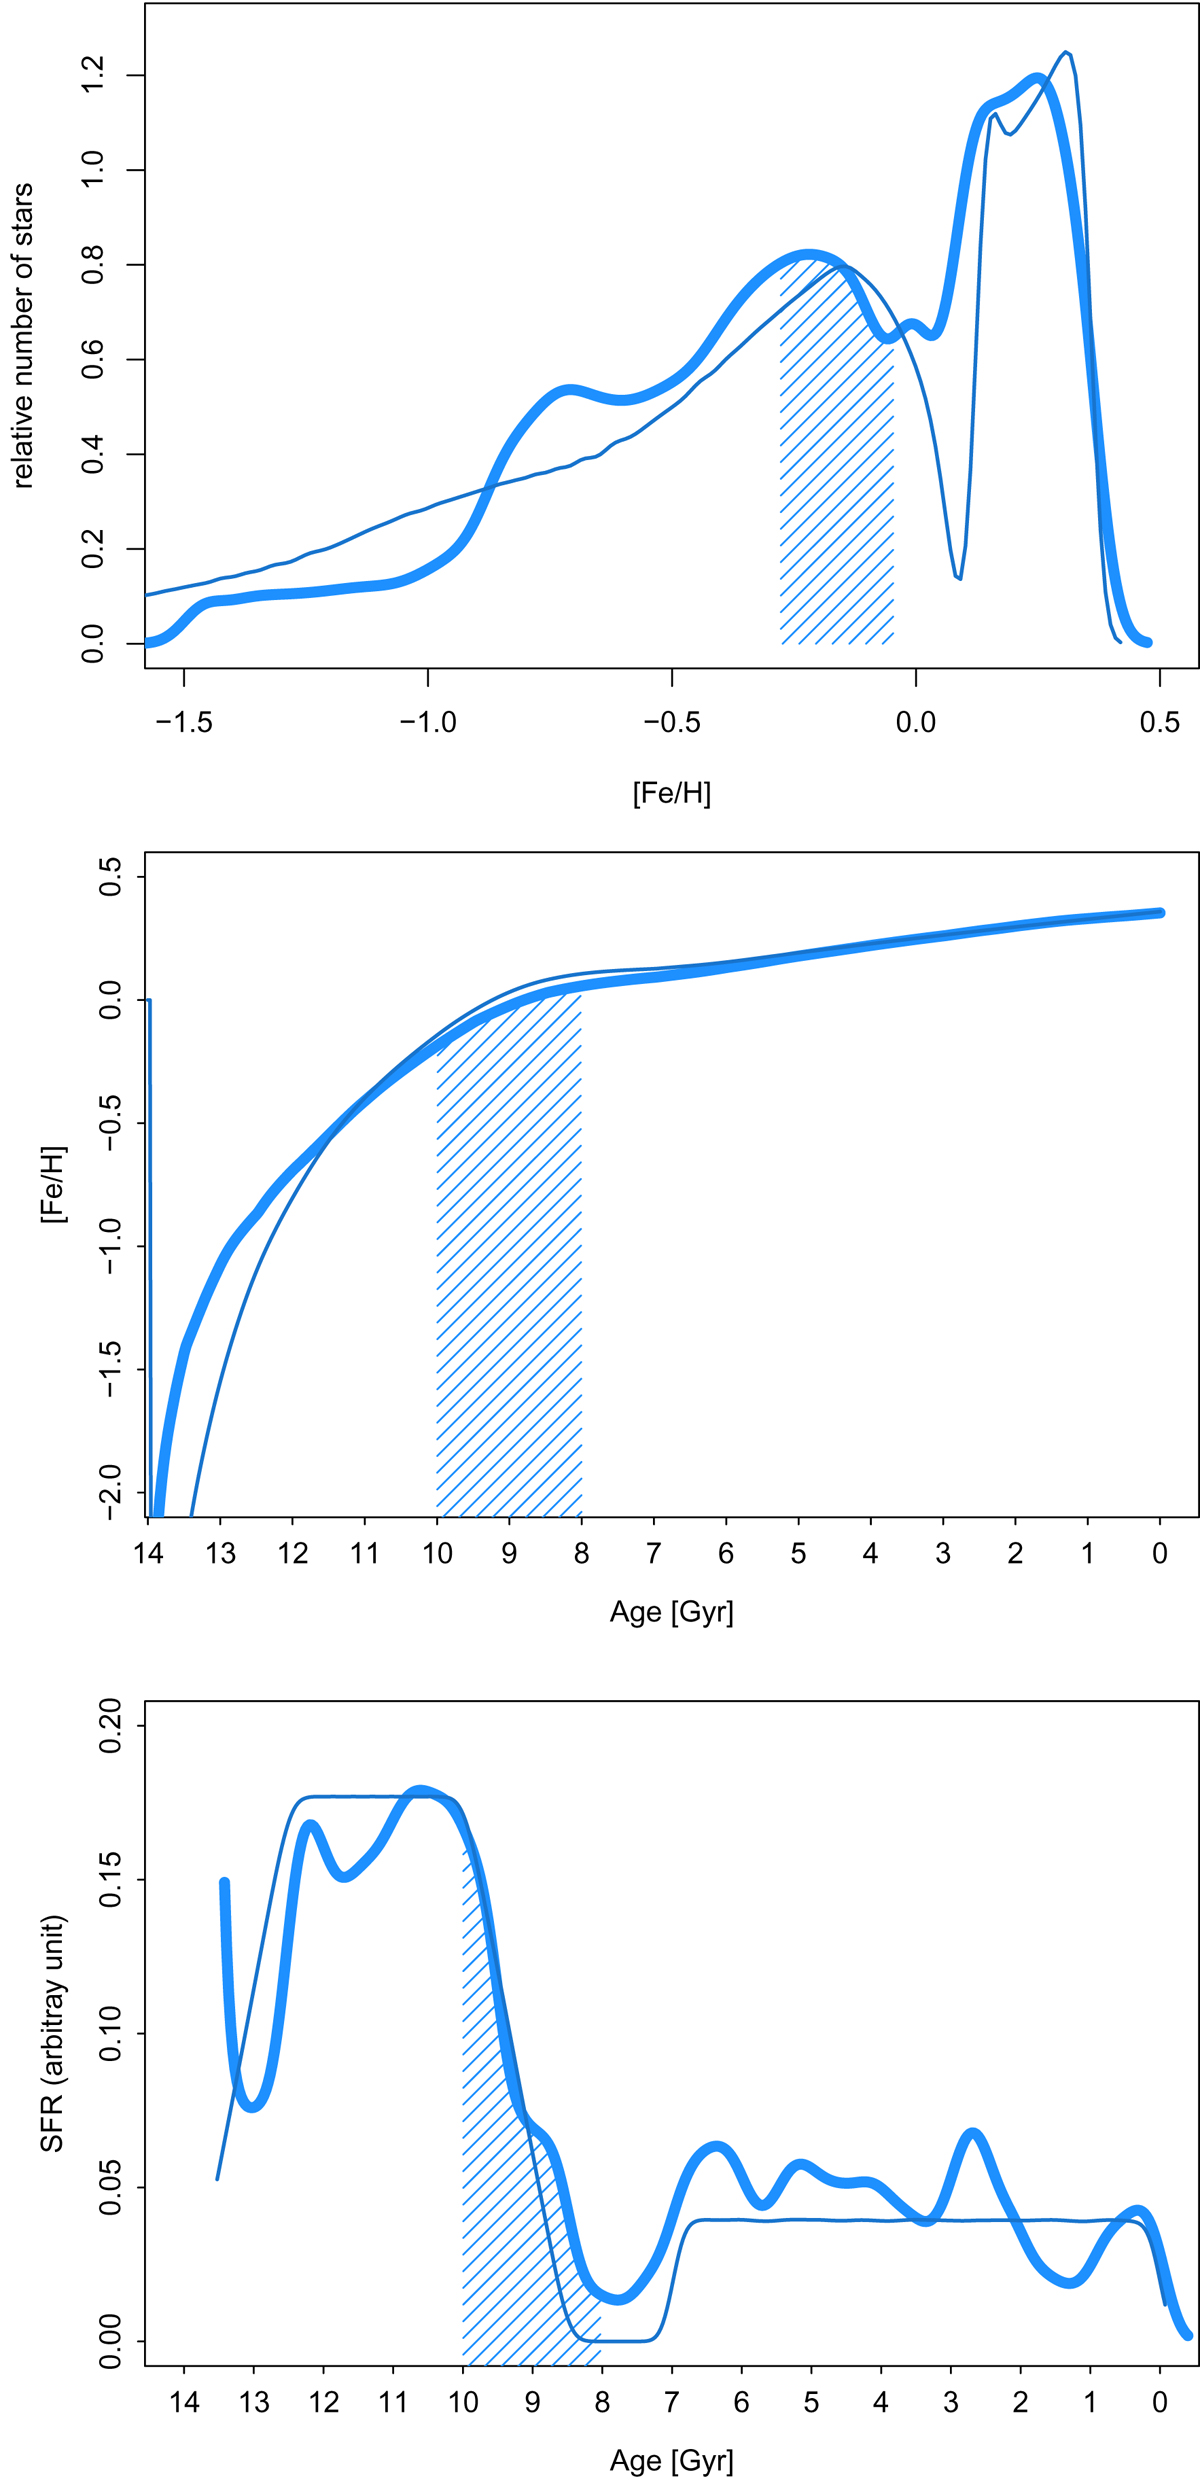
Distributions of our inner disk model. Bottom panel: SFH; middle: age-metallicity relation; top: metallicity distribution. The thick curve corresponds to the best fit model derived in Snaith et al. (2015), or “fiducial model”, while the thin curve represents the same model, but where the small-scale variations in the SFH have been smoothed out. It shows in particular that the third peak (at [Fe/H] ∼ −0.8 dex) in the Snaith et al. (2015) is due to the small peak in the SFH at age ∼12 Gyr, and is probably not significant. The blue area in each plot emphasizes the quenching epoch of the SFR in the MDF and age-metallicity relation.
Current usage metrics show cumulative count of Article Views (full-text article views including HTML views, PDF and ePub downloads, according to the available data) and Abstracts Views on Vision4Press platform.
Data correspond to usage on the plateform after 2015. The current usage metrics is available 48-96 hours after online publication and is updated daily on week days.
Initial download of the metrics may take a while.