Fig. 10.
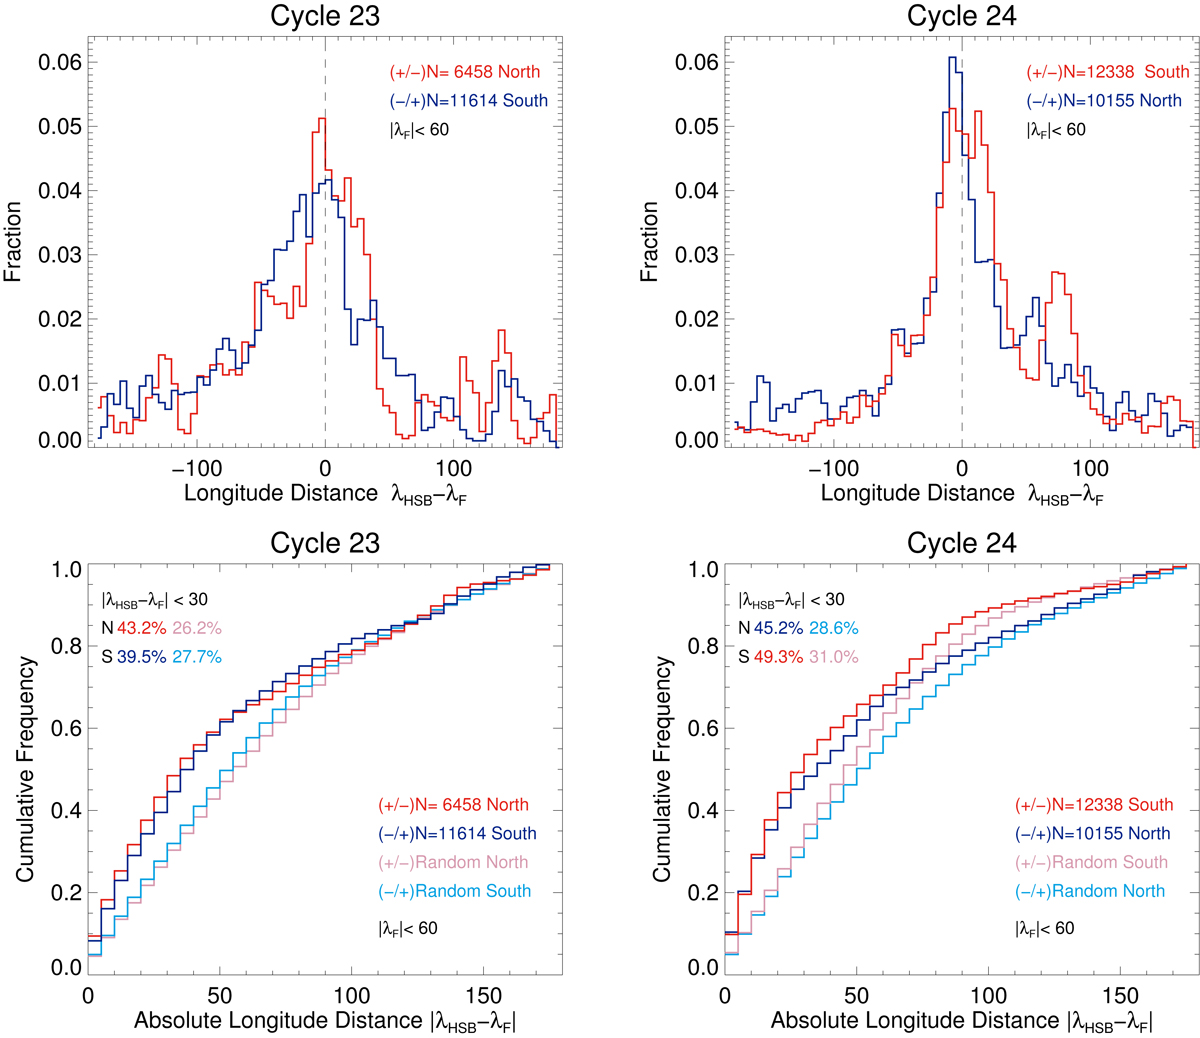
Longitudinal distance histograms (top row) of RHESSI flares with |λF| ≤ 60° from the HSB PFSS, for solar Cycle 23 and 24 (left and right columns). With red, the change in polarity from positive to negative and blue from negative to positive. Cumulative distributions of these histograms (bottom row), with additional cumulative distributions over-plotted that were produced from a set of flares with longitudes drawn from a random distribution (pink for change in polarity from positive to negative and light blue for change in polarity from negative to positive).
Current usage metrics show cumulative count of Article Views (full-text article views including HTML views, PDF and ePub downloads, according to the available data) and Abstracts Views on Vision4Press platform.
Data correspond to usage on the plateform after 2015. The current usage metrics is available 48-96 hours after online publication and is updated daily on week days.
Initial download of the metrics may take a while.