Fig. 1.
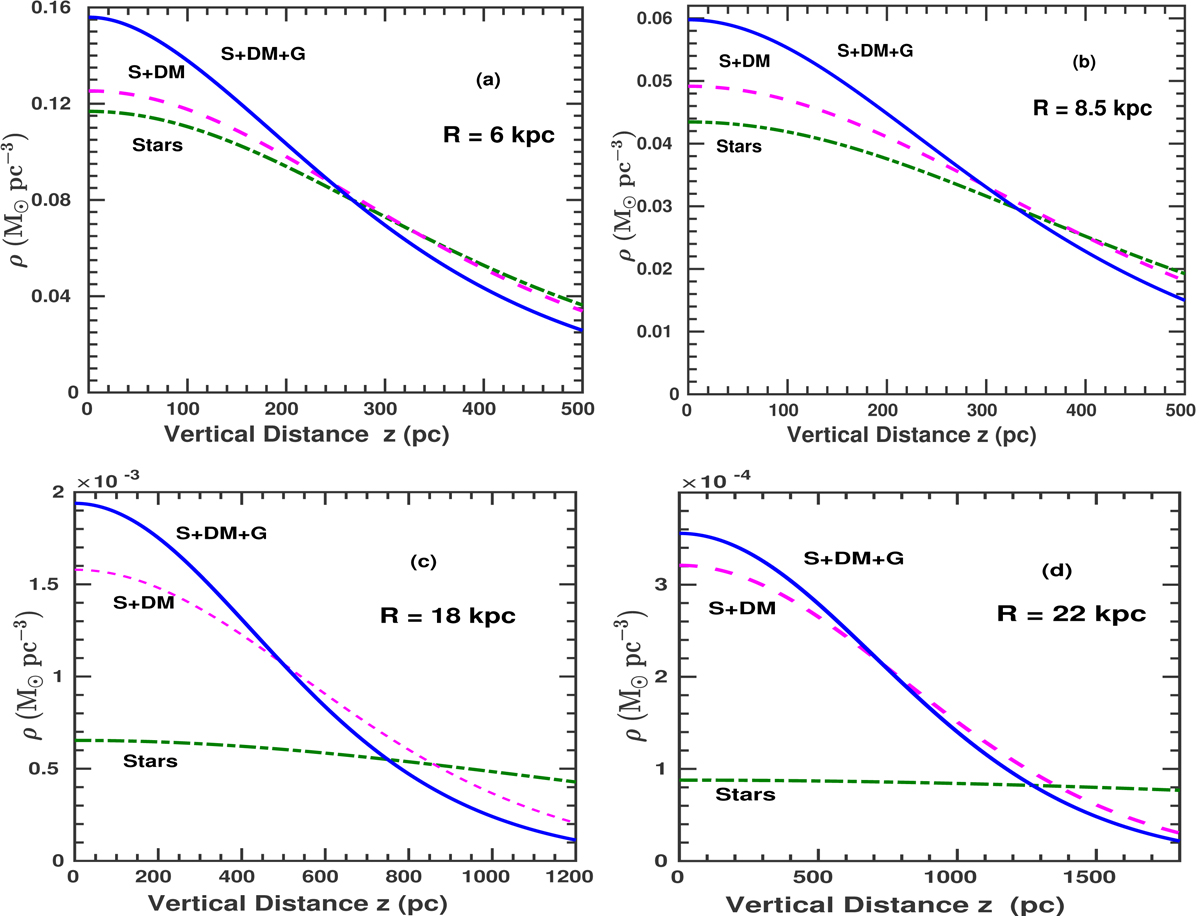
Vertical density distribution of stars vs. z at four different radii, R = 6 and 8.5 kpc in the inner Galaxy (panels a, b) and at R = 18 and 22 kpc in the outer Galaxy (panels c, d). The three curves represent the density distribution of stars in the gravitational field of stars-alone, stars plus dark matter halo, and stars plus dark matter halo plus gas cases. The addition of other gravitating components (gas and halo) increases the mid-plane stellar density value that causes the scale height to become smaller and the curve to become steeper. The constraining effect is mainly due to gas in the inner Galaxy (panels a, b); while in the outer Galaxy (panels c, d), the dark matter halo has the dominant constraining effect.
Current usage metrics show cumulative count of Article Views (full-text article views including HTML views, PDF and ePub downloads, according to the available data) and Abstracts Views on Vision4Press platform.
Data correspond to usage on the plateform after 2015. The current usage metrics is available 48-96 hours after online publication and is updated daily on week days.
Initial download of the metrics may take a while.