Fig. 9.
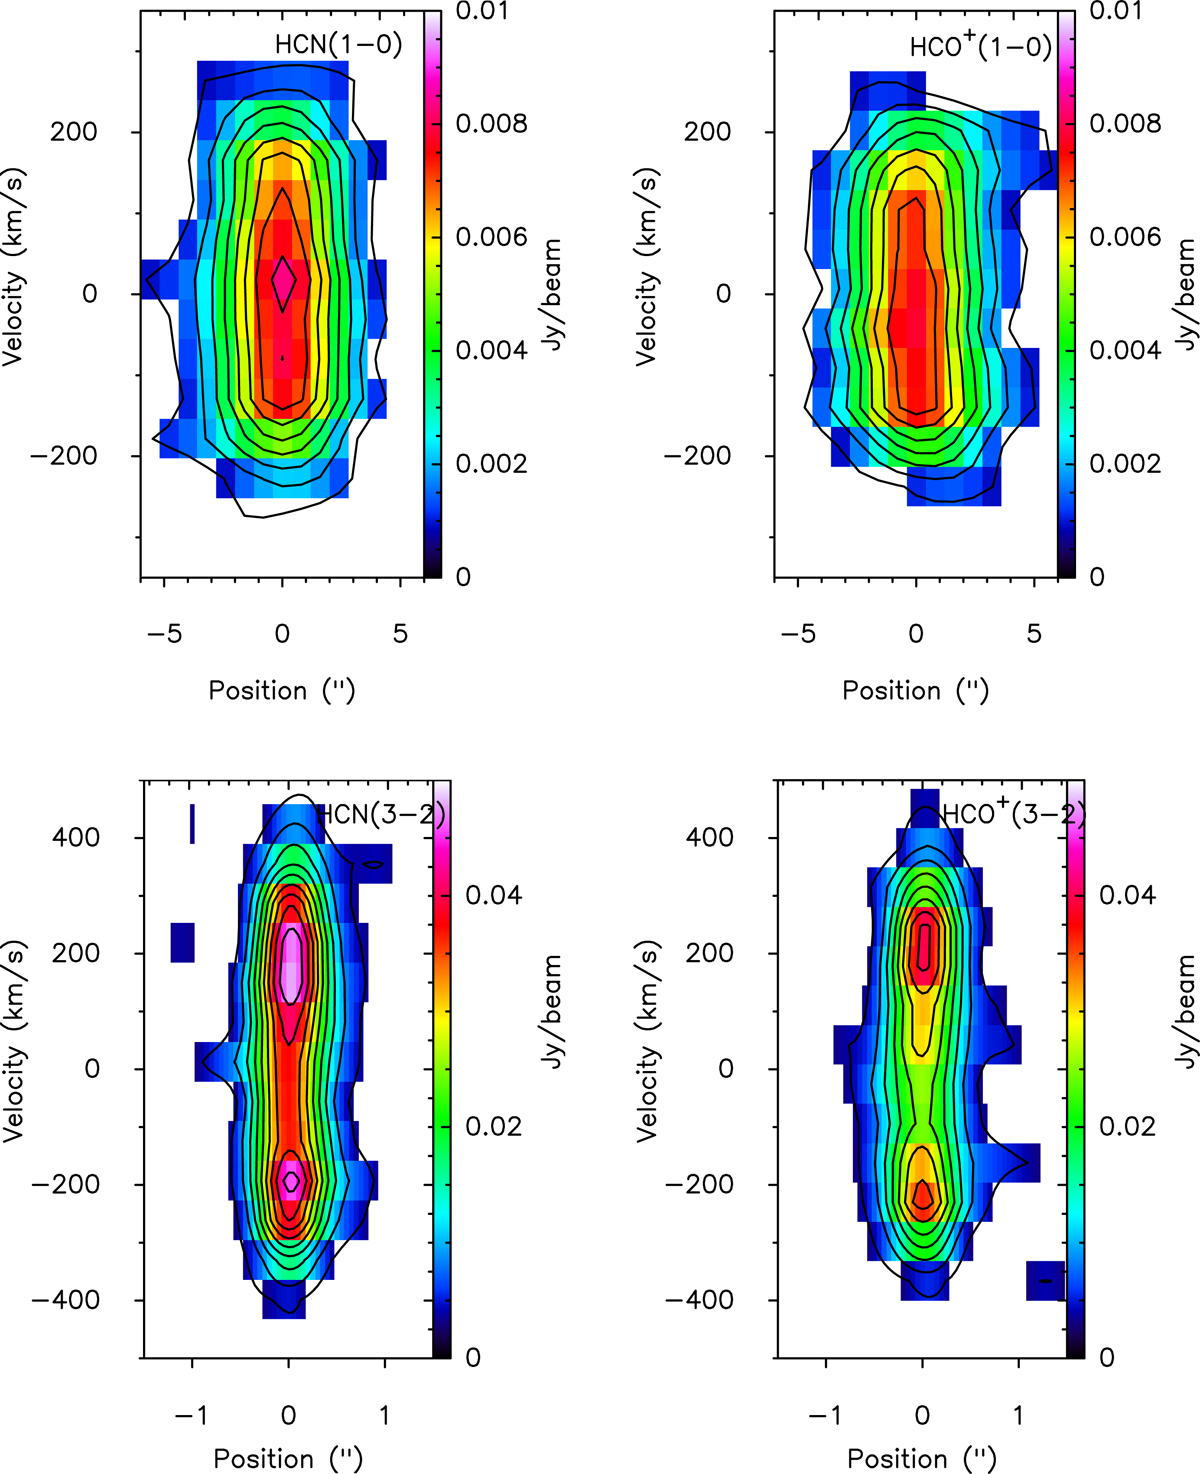
Position-velocity (p-v) maps of HCN and HCO+. The cuts along the axes of rotation are shown by the dashed lines in Fig. 8. Contour steps of the (1 − 0) maps go from 0.9 mJy beam−1 (3σ) to 7.9 mJy beam−1 with steps of 1 mJy beam−1. For the (3 − 2) maps, contours go from 3.9 mJy beam−1 (3σ) to 59 mJy beam−1 with steps of 5 mJy beam−1.
Current usage metrics show cumulative count of Article Views (full-text article views including HTML views, PDF and ePub downloads, according to the available data) and Abstracts Views on Vision4Press platform.
Data correspond to usage on the plateform after 2015. The current usage metrics is available 48-96 hours after online publication and is updated daily on week days.
Initial download of the metrics may take a while.