Fig. 8.
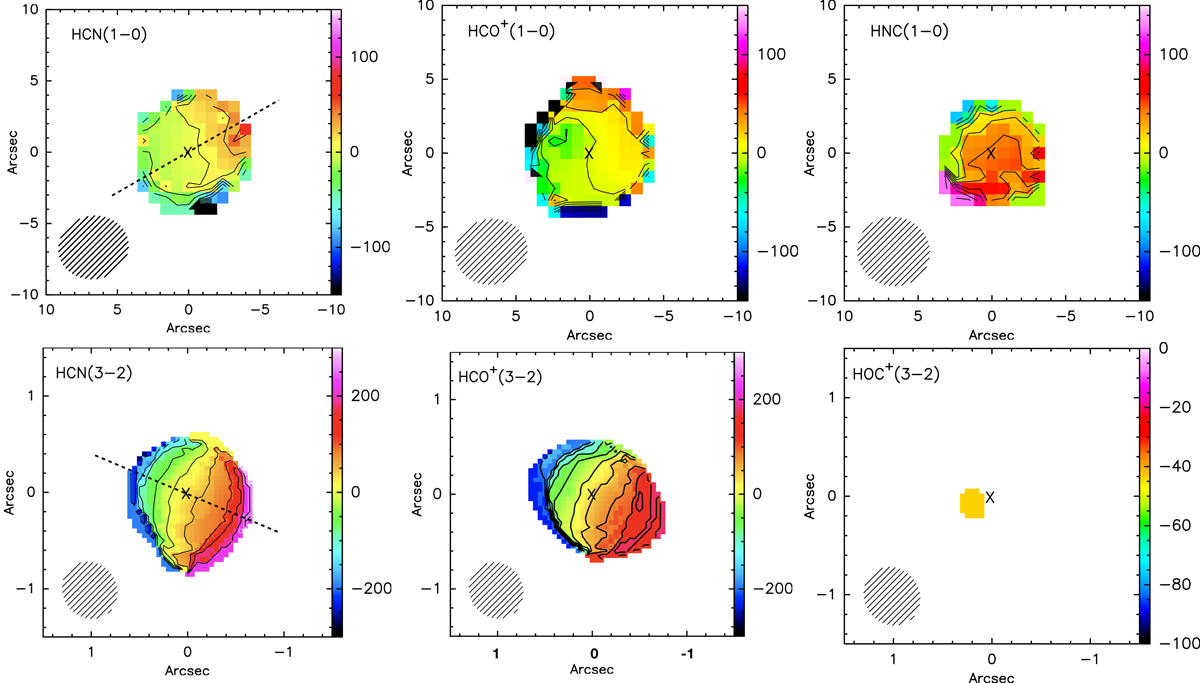
Velocity fields (moment 1 maps). The coloured velocity scale (right axis) is in km s−1. The step in contours is 20 kms−1 for all lines. We note the blue-shifted velocities of HOC+(3 − 2). The crosses in the centre of each panel indicate the position of the nuclear source. The beam is shown in the lower left corner of each panel. North is up, and east is to the left. The dashed lines in the HCN plots indicate the cut for the p − v diagrams shown in Fig. 9.
Current usage metrics show cumulative count of Article Views (full-text article views including HTML views, PDF and ePub downloads, according to the available data) and Abstracts Views on Vision4Press platform.
Data correspond to usage on the plateform after 2015. The current usage metrics is available 48-96 hours after online publication and is updated daily on week days.
Initial download of the metrics may take a while.