Fig. 7.
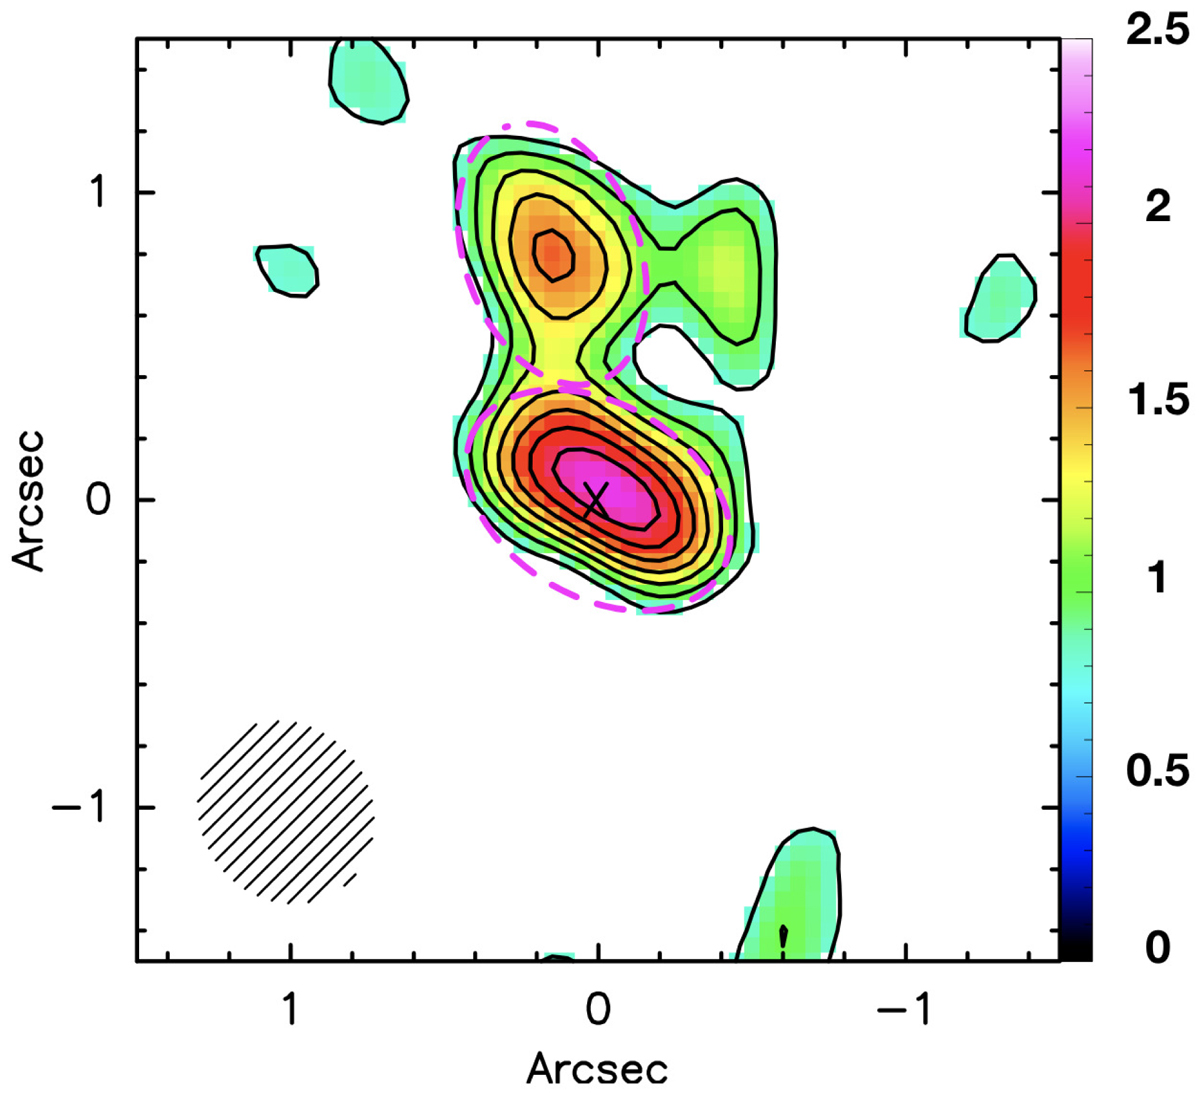
Integrated intensity of the outflow seen in HCN (3 − 2) between −1100 km s−1 and −400 km s−1 (yellow region marked in Fig. 5). The cross in the centre marks the location of the nuclear source. The contours start with a 5σ flux and go from 0.8 mJy kms−1 beam−1 to 2.5 Jy kms−1 beam−1 with steps of 0.2 mJy kms−1 beam−1. The magenta dashed ellipses show the regions fitted to the two main components. The synthesised beam is plotted in the bottom-left corner.
Current usage metrics show cumulative count of Article Views (full-text article views including HTML views, PDF and ePub downloads, according to the available data) and Abstracts Views on Vision4Press platform.
Data correspond to usage on the plateform after 2015. The current usage metrics is available 48-96 hours after online publication and is updated daily on week days.
Initial download of the metrics may take a while.