Fig. 6.
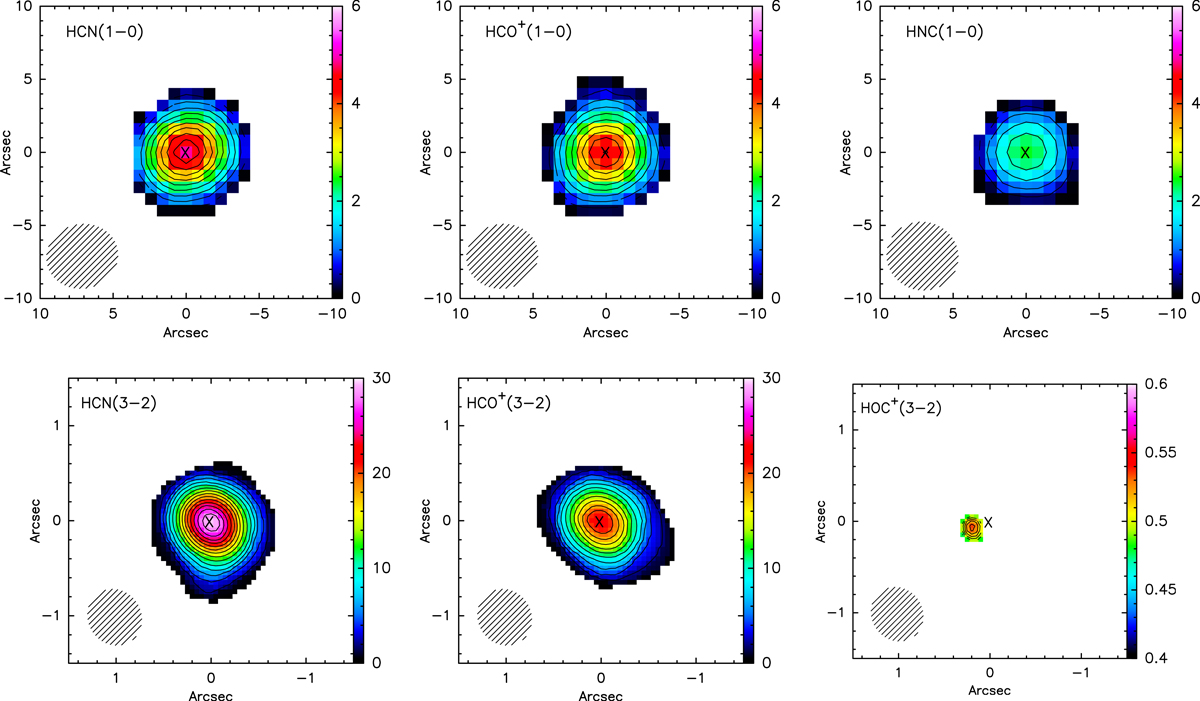
Integrated intensities (moment zero maps). Contour levels for HCN, HCO+ and HNC (1 − 0) go from 0 to 6 Jy kms−1 beam−1 with a step of 0.5 Jy kms−1 beam−1. For HCN (3 − 2) and HCO +(3 − 2) the levels range from 2 to 30 Jy kms−1 beam−1 with a step of 2 Jy kms−1 beam−1. For HOC+(3 − 2), the contours are from 0.4 to 0.6 Jy kms−1 beam−1 with a step of 0.04 Jy kms−1 beam−1. We highlight the different scales between the (1 − 0) and the (3 − 2) lines. The crosses in the centre of each panel indicate the location of the nuclear source. The synthesised beam is shown in the bottom-left corner of each panel. North is up, and east is to the left.
Current usage metrics show cumulative count of Article Views (full-text article views including HTML views, PDF and ePub downloads, according to the available data) and Abstracts Views on Vision4Press platform.
Data correspond to usage on the plateform after 2015. The current usage metrics is available 48-96 hours after online publication and is updated daily on week days.
Initial download of the metrics may take a while.