Free Access
Fig. 5.
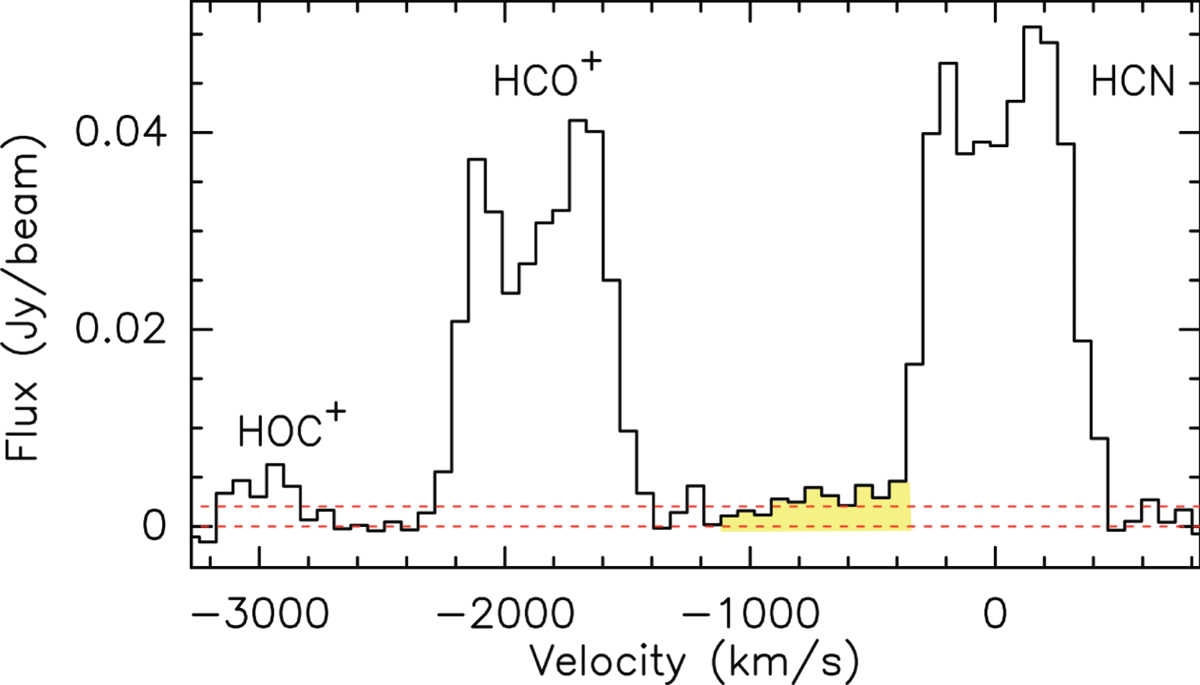
Spectrum of the central pixel for the (J − J′) = (3 − 2) lines of HCN, HCO+ and HOC+. The baseline of order 0 and the 3 × rms flux (calculated at the final velocity resolution of 68 km s−1) are marked with horizontal dashed lines. The outflow emission at the blue-shifted velocities of HCN is highlighted in yellow.
Current usage metrics show cumulative count of Article Views (full-text article views including HTML views, PDF and ePub downloads, according to the available data) and Abstracts Views on Vision4Press platform.
Data correspond to usage on the plateform after 2015. The current usage metrics is available 48-96 hours after online publication and is updated daily on week days.
Initial download of the metrics may take a while.