Fig. 2.
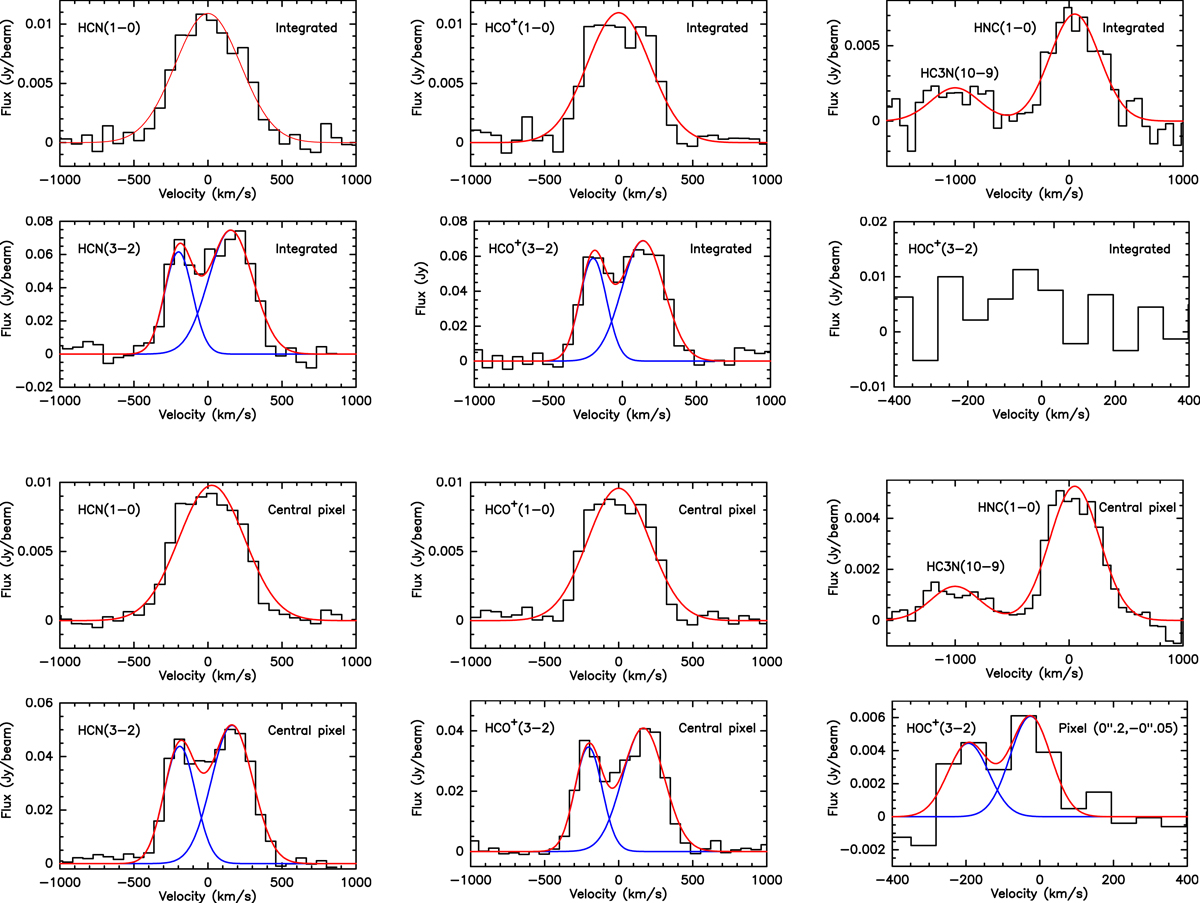
Emission lines detected with NOEMA (black histograms) and Gaussian fits (total: red lines; if two components are present, individual components are displayed in blue colour). The velocity resolution is 68 km s−1 in all cases. The labels in the top right corners indicate if the spectra were extracted from the integrated emission (“Integrated”, top panels), from the central pixel (bottom panels), or in the case of HOC+, from the pixel at (0ʺ̣2, −0ʺ̣05).
Current usage metrics show cumulative count of Article Views (full-text article views including HTML views, PDF and ePub downloads, according to the available data) and Abstracts Views on Vision4Press platform.
Data correspond to usage on the plateform after 2015. The current usage metrics is available 48-96 hours after online publication and is updated daily on week days.
Initial download of the metrics may take a while.