Free Access
Fig. 17.
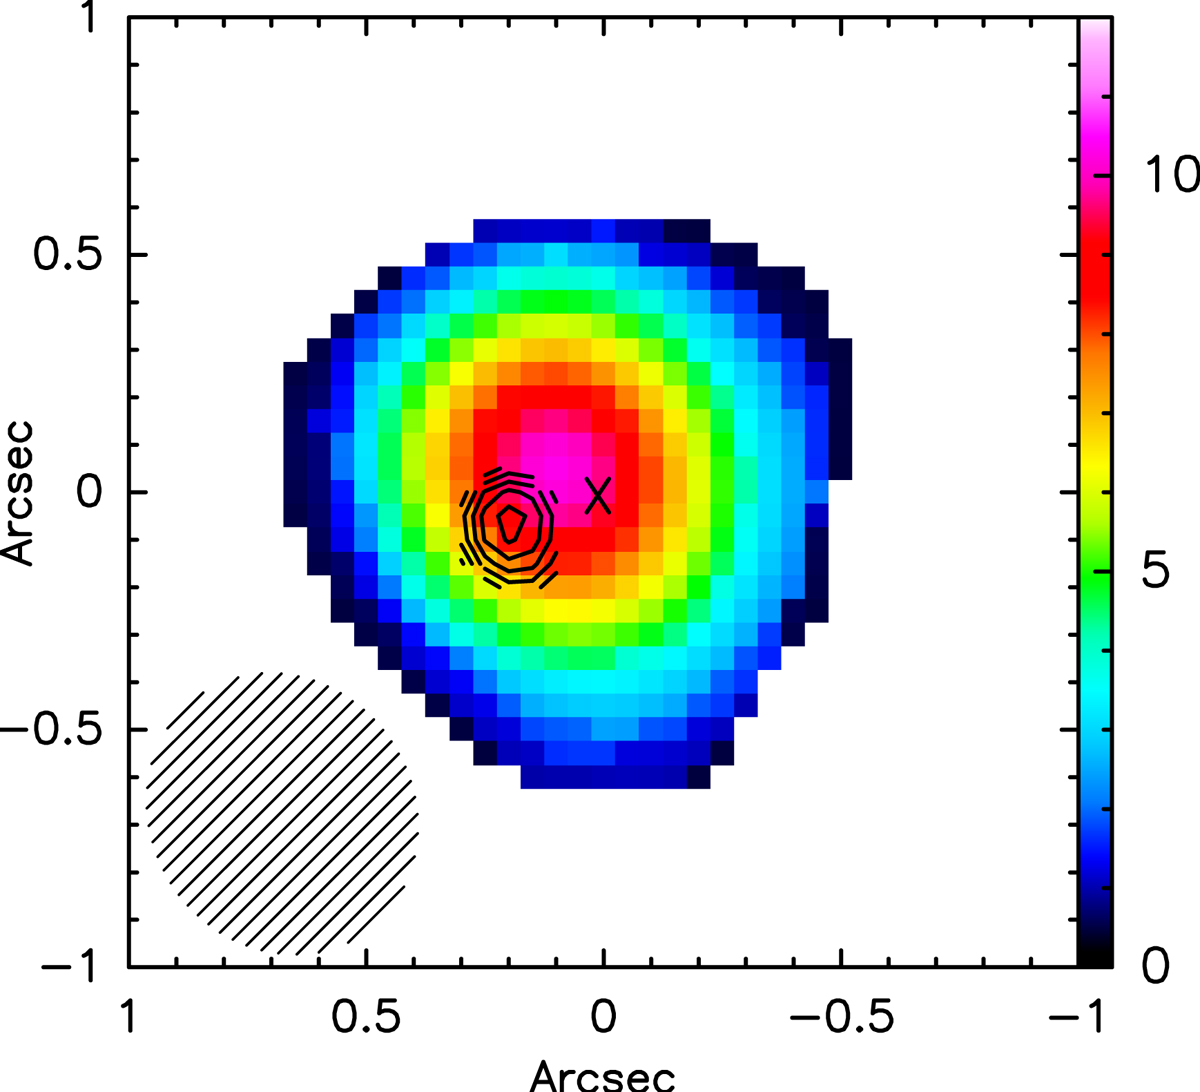
HCO+(3 − 2) blue-shifted intensity colours (in units of Jy km s−1 beam−1) integrated from −300 km s−1 to 0 km s−1 with HOC+(3 − 2) contours (starting from 3σ = 3.3 mJy beam−1) over-plotted with steps of 10 mJy beam−1. The cross at the centre marks the continuum peak. The synthesised beam is shown in the bottom-left corner.
Current usage metrics show cumulative count of Article Views (full-text article views including HTML views, PDF and ePub downloads, according to the available data) and Abstracts Views on Vision4Press platform.
Data correspond to usage on the plateform after 2015. The current usage metrics is available 48-96 hours after online publication and is updated daily on week days.
Initial download of the metrics may take a while.