Fig. 16.
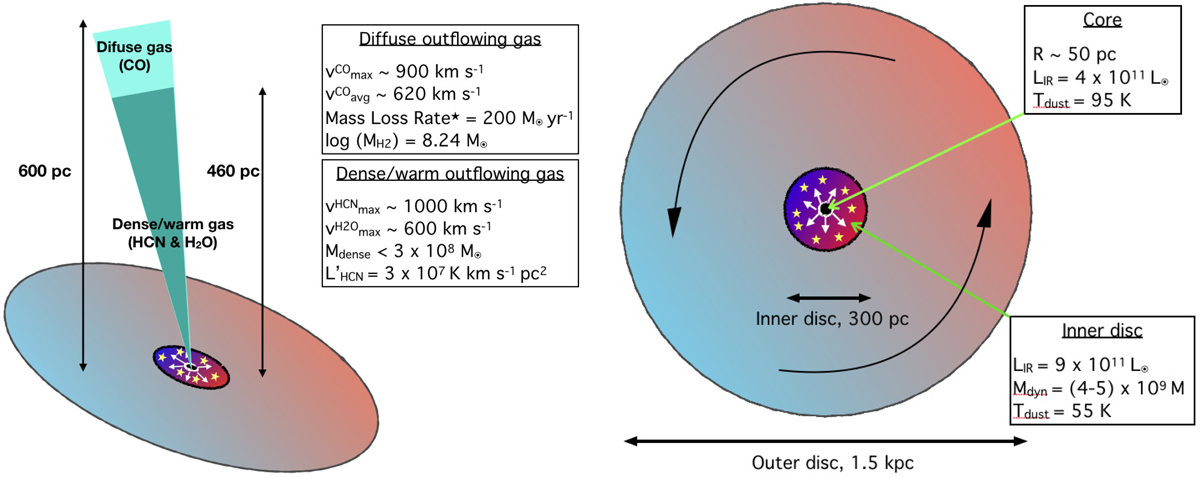
Left: sketch of the blue-shifted molecular outflow in the northern nucleus of Mrk 273. The dense and warm outflowing gas found in our HCN and H2O data, and its properties, is compared to the diffuse outflow found by Cicone et al. (2014) by observing CO (1 − 0). ⋆We note that the mass loss rate is calculated as Ṁ = v (MOF/ROF) (see Sect. 5.5 in González-Alfonso et al. 2017), which is a factor of three lower than the value given by Cicone et al. (2014). The position angles of the outflow (10°) and the inner disc (70°) are represented. Right: a face-on sketch of the three disc components identified in our data (outer disc, inner disc, and core), which are plotted in scaled sizes. The decoupled kinematics of the outer and inner discs are represented by the blue and red colours, which depict the orientation of the blue-shifted and red-shifted rotating gas. The rotation direction is indicated by the curved arrows. The intensity of the colours illustrate the velocities; the inner disc rotates at a higher speed than the outer disc. The stars in the inner disc aim to show the region where most of the starburst is located. The radial arrows represent the low-velocity expansion of the core.
Current usage metrics show cumulative count of Article Views (full-text article views including HTML views, PDF and ePub downloads, according to the available data) and Abstracts Views on Vision4Press platform.
Data correspond to usage on the plateform after 2015. The current usage metrics is available 48-96 hours after online publication and is updated daily on week days.
Initial download of the metrics may take a while.