Fig. 15.
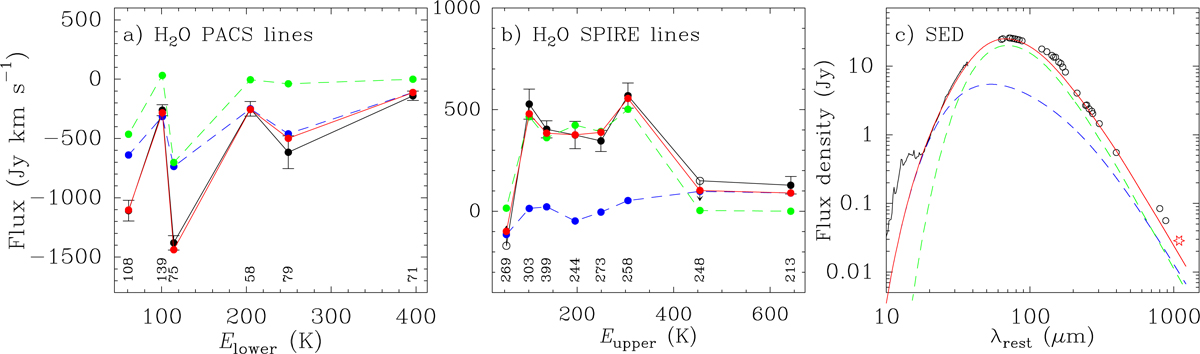
Comparison between the observed (black symbols) and modelled (coloured symbols and lines) H2O fluxes in Mrk 273 within panel a: PACS and panel b: SPIRE. The model includes two components: the core (in blue), which accounts for most absorption lines observed within PACS, and the inner disc (in green), which dominates the emission of the sub-mm lines with Eupper < 400 K observed with SPIRE (see Table 4). Red colours and symbols indicate total modelled fluxes. The numbers at the bottom of panels a and b indicate rounded-up transition wavelengths in μm. Panel c: the SED of Mrk 273, including the Spitzer/IRS spectrum, Herschel/PACS and SPIRE continuum data from observations of both H2O and OH lines, sub-mm data at 800 and 880 μm (Rigopoulou et al. 1996; Wilson 2008), and our measured flux density at 1 mm (starred-red symbol), is compared with the prediction of our composite model.
Current usage metrics show cumulative count of Article Views (full-text article views including HTML views, PDF and ePub downloads, according to the available data) and Abstracts Views on Vision4Press platform.
Data correspond to usage on the plateform after 2015. The current usage metrics is available 48-96 hours after online publication and is updated daily on week days.
Initial download of the metrics may take a while.