Fig. 14.
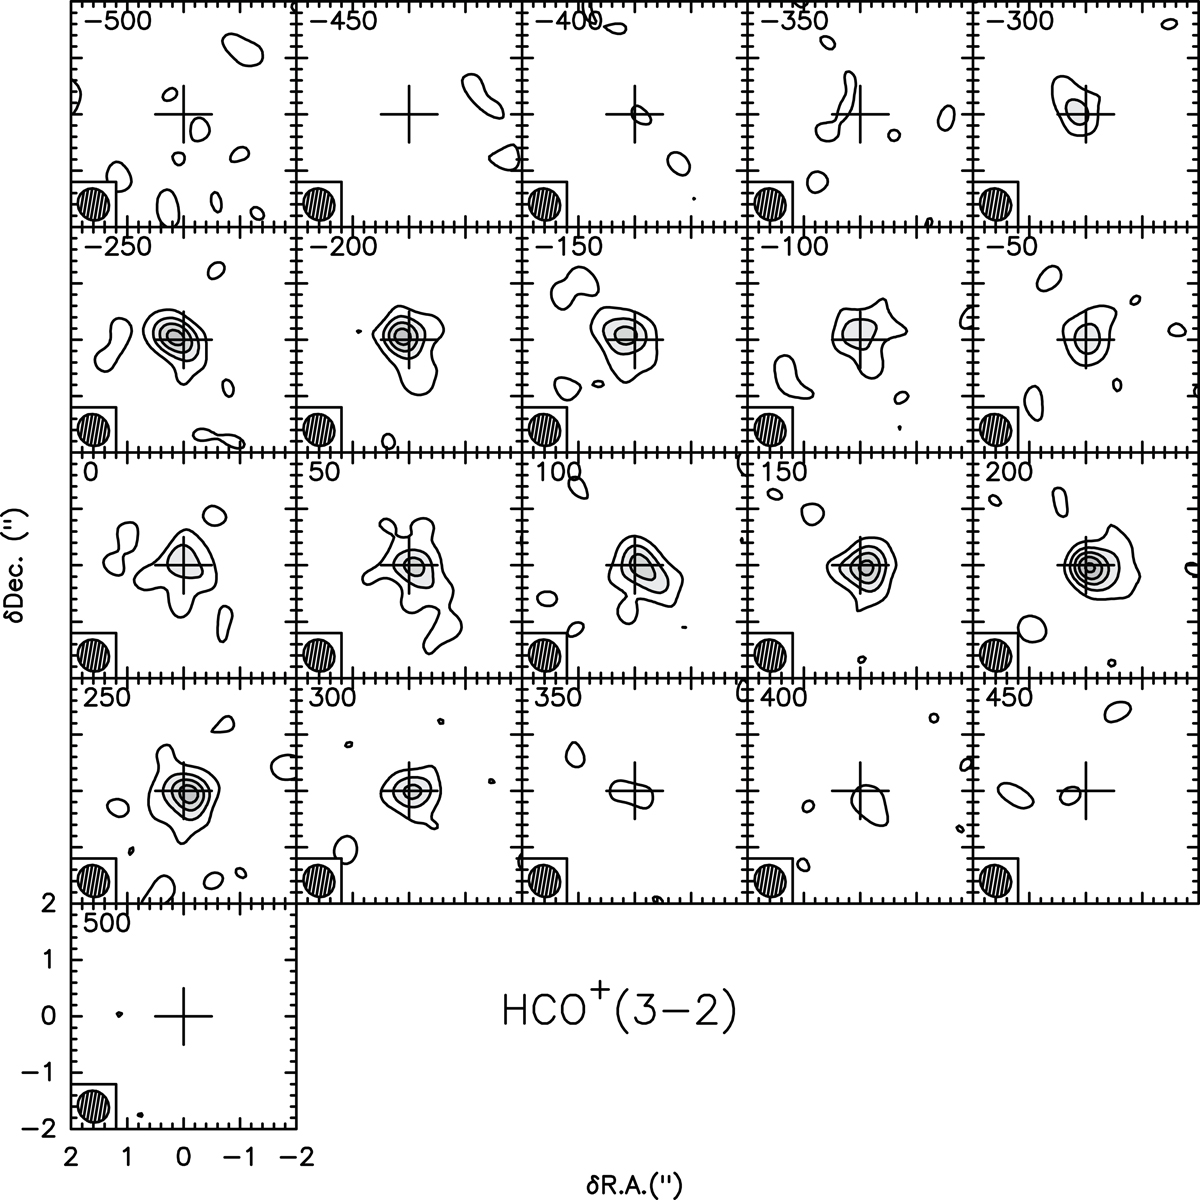
Channel-velocity maps of HCO+(3 − 2) in the velocity range [−500, 500] km s−1 with steps of 50 km s−1. Contours go from 6.5 mJy beam−1 (5σ) to 56 mJy beam−1 with a spacing of 10 mJy beam−1. We highlight the significantly smaller spatial scale relative to the channel maps of the (1 − 0) line shown in Fig. 12. The synthesised beam is plotted in the bottom-left corner. North is up and east is to the left.
Current usage metrics show cumulative count of Article Views (full-text article views including HTML views, PDF and ePub downloads, according to the available data) and Abstracts Views on Vision4Press platform.
Data correspond to usage on the plateform after 2015. The current usage metrics is available 48-96 hours after online publication and is updated daily on week days.
Initial download of the metrics may take a while.