Fig. 1.
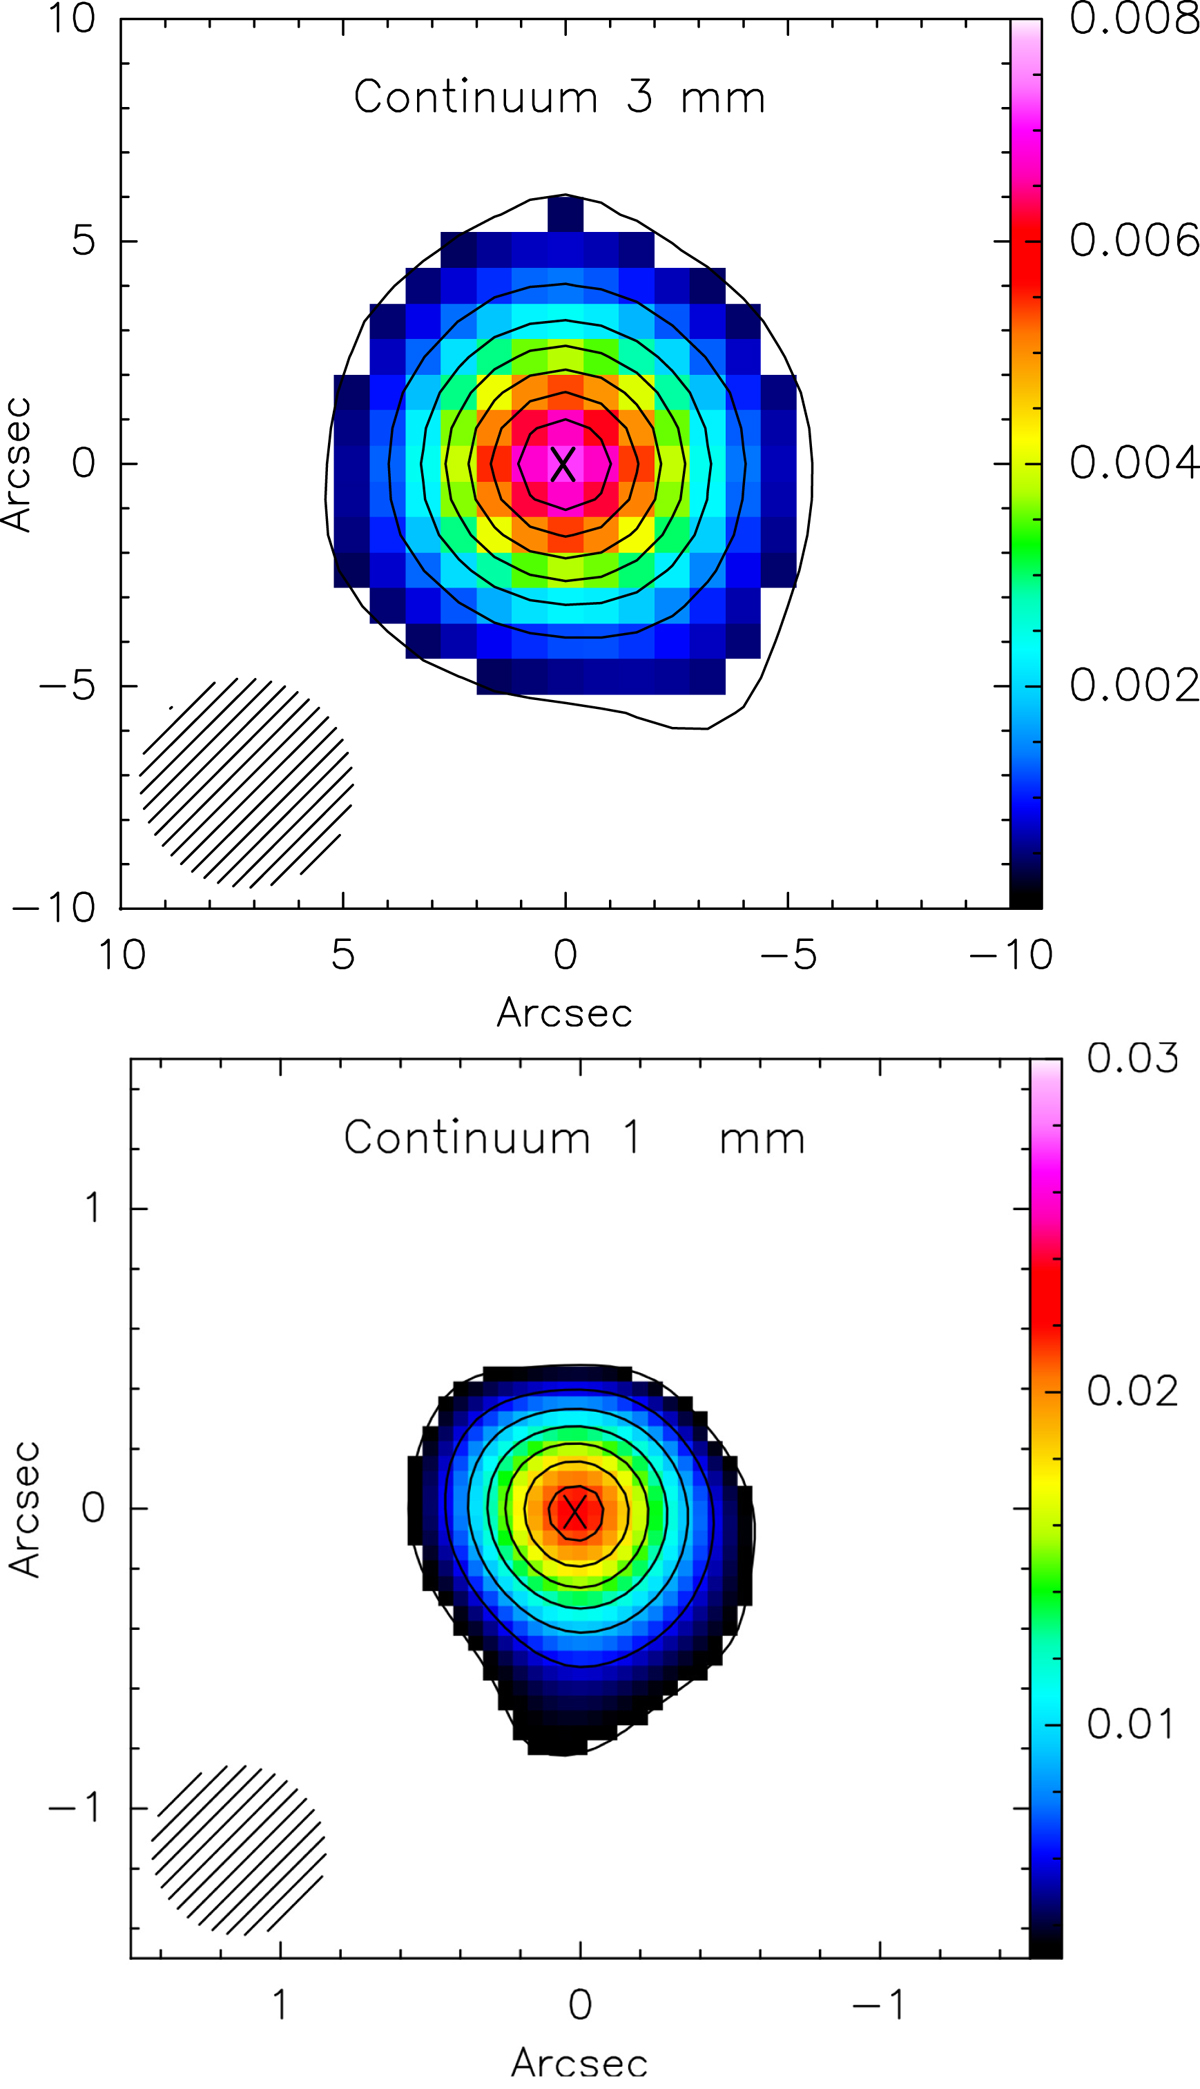
Continuum maps at 3 mm and 1 mm. Contour levels start at a significance of 5σ with respect to the rms measured in both images (rms = 0.07 mJy channel−1 and 0.6 mJy channel−1 for the 3 mm and 1 mm maps respectively). The contour steps are 1 and 3 mJy km s−1 beam−1. The crosses at the centres mark the continuum peaks, which we take as the location of the northern nuclear source (see Sect. 1). The synthesised beams are shown in the bottom-left corner. The colour flux scales are in Jy km s−1 beam−1.
Current usage metrics show cumulative count of Article Views (full-text article views including HTML views, PDF and ePub downloads, according to the available data) and Abstracts Views on Vision4Press platform.
Data correspond to usage on the plateform after 2015. The current usage metrics is available 48-96 hours after online publication and is updated daily on week days.
Initial download of the metrics may take a while.