Fig. 3.
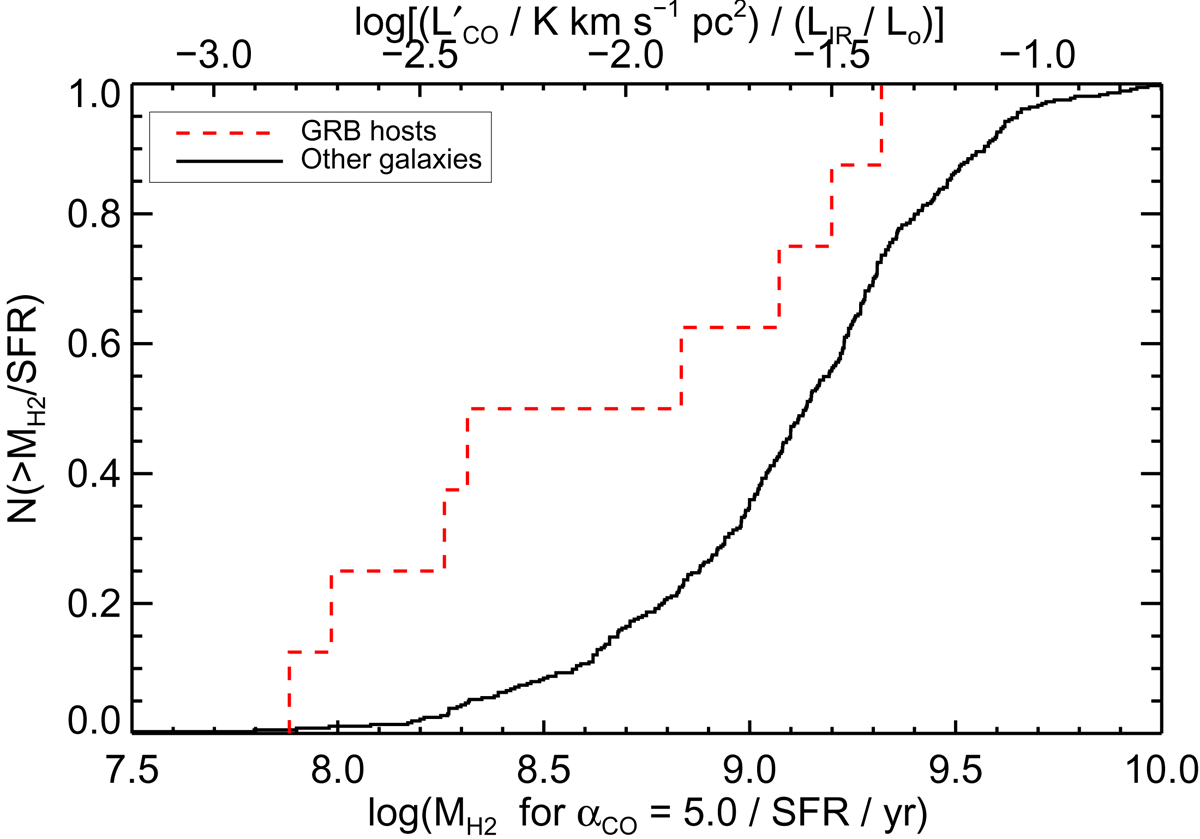
Cumulative distribution of molecular gas depletion time (or the inverse of the star formation efficiency), i.e. the ratio of the CO luminosity to the infrared luminosity or the corresponding molecular gas mass with the CO-to-H2 conversion factor αCO = 5 M⊙ (K km s−1 pc2)−1 to the star formation rate (SFR). The distribution of GRB hosts is shown as the dashed red line, whereas that of other galaxies is shown as the solid black line. We treated the upper limits as actual values, so the histogram for GRB hosts is an upper limit. GRB hosts are systematically shifted to the left on this diagram (lower MH2 given their SFRs), but this is not statistically significant (see Sect. 3.1).
Current usage metrics show cumulative count of Article Views (full-text article views including HTML views, PDF and ePub downloads, according to the available data) and Abstracts Views on Vision4Press platform.
Data correspond to usage on the plateform after 2015. The current usage metrics is available 48-96 hours after online publication and is updated daily on week days.
Initial download of the metrics may take a while.