Fig. 1.
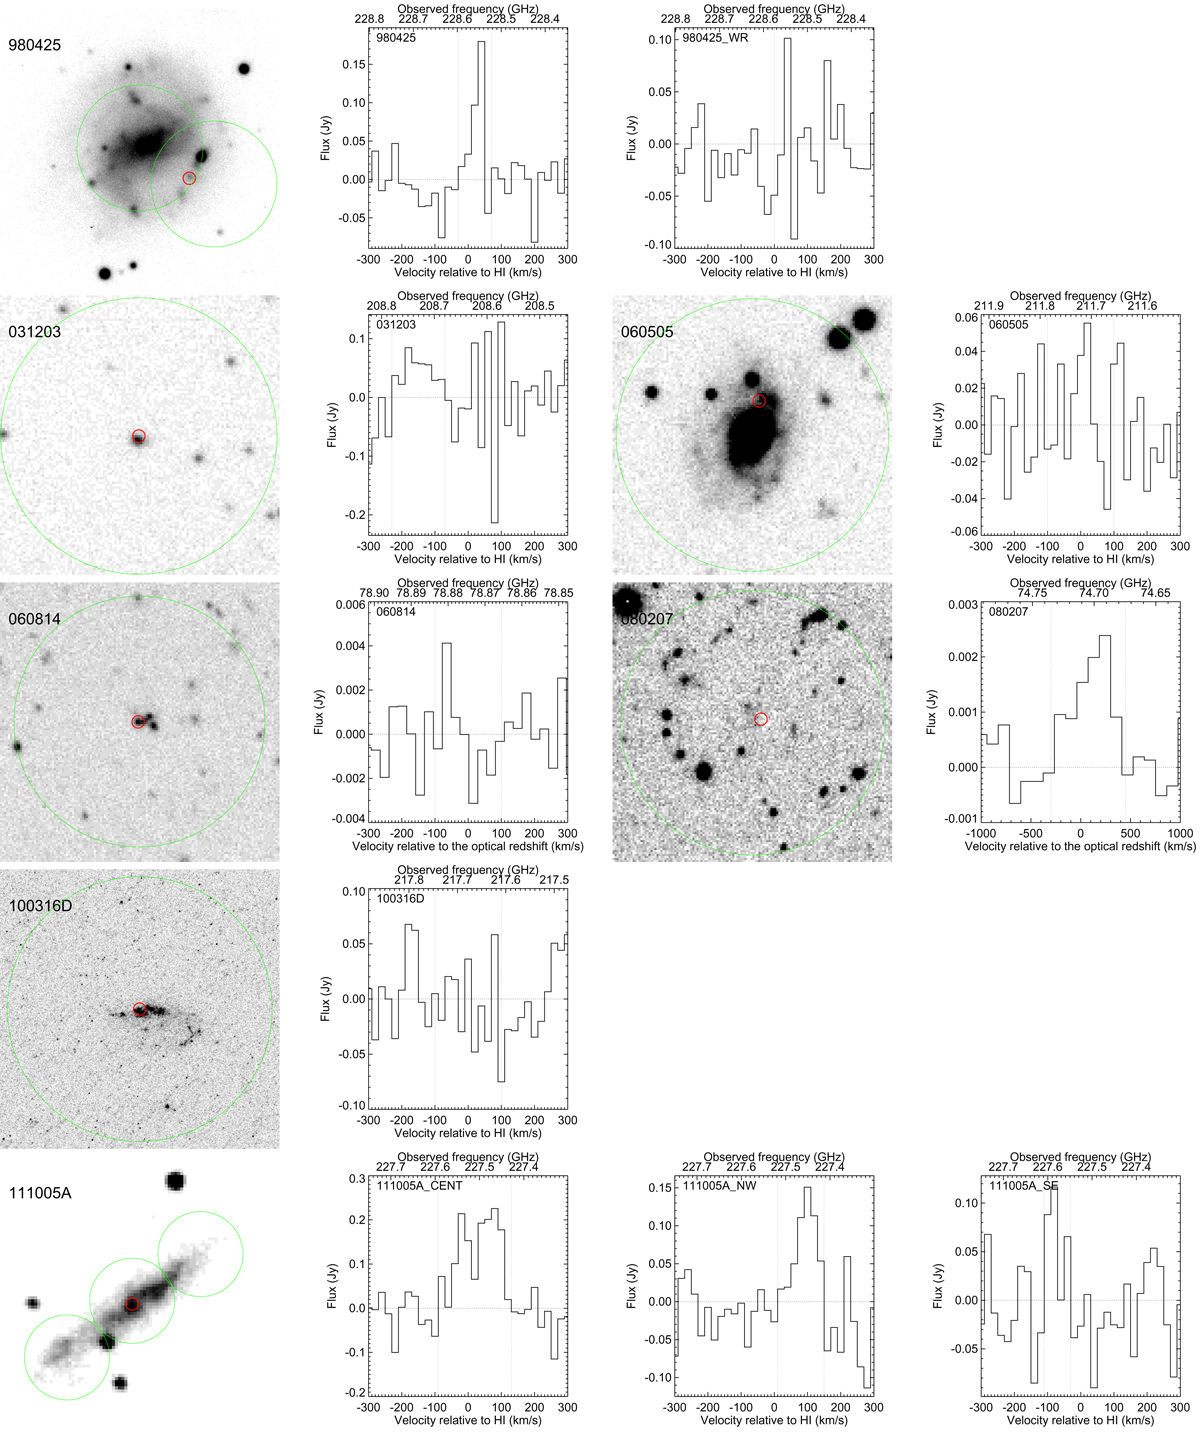
For each GRB host (labelled in the top left corner of each panel), first panel: optical image (Sollerman et al. 2005; Mazzali et al. 2006; Thöne et al. 2008; Hjorth et al. 2012; Starling et al. 2011; Michałowski et al. 2018a) together with the green circles marking the positions of the pointings and the beam sizes of our CO(2-1) observations. GRB positions are marked with red circles. North is up and east is to the left. Other panels: corresponding CO(2-1) spectra. Vertical dotted lines show the velocity intervals within which the line fluxes were measured.
Current usage metrics show cumulative count of Article Views (full-text article views including HTML views, PDF and ePub downloads, according to the available data) and Abstracts Views on Vision4Press platform.
Data correspond to usage on the plateform after 2015. The current usage metrics is available 48-96 hours after online publication and is updated daily on week days.
Initial download of the metrics may take a while.