Fig. 4
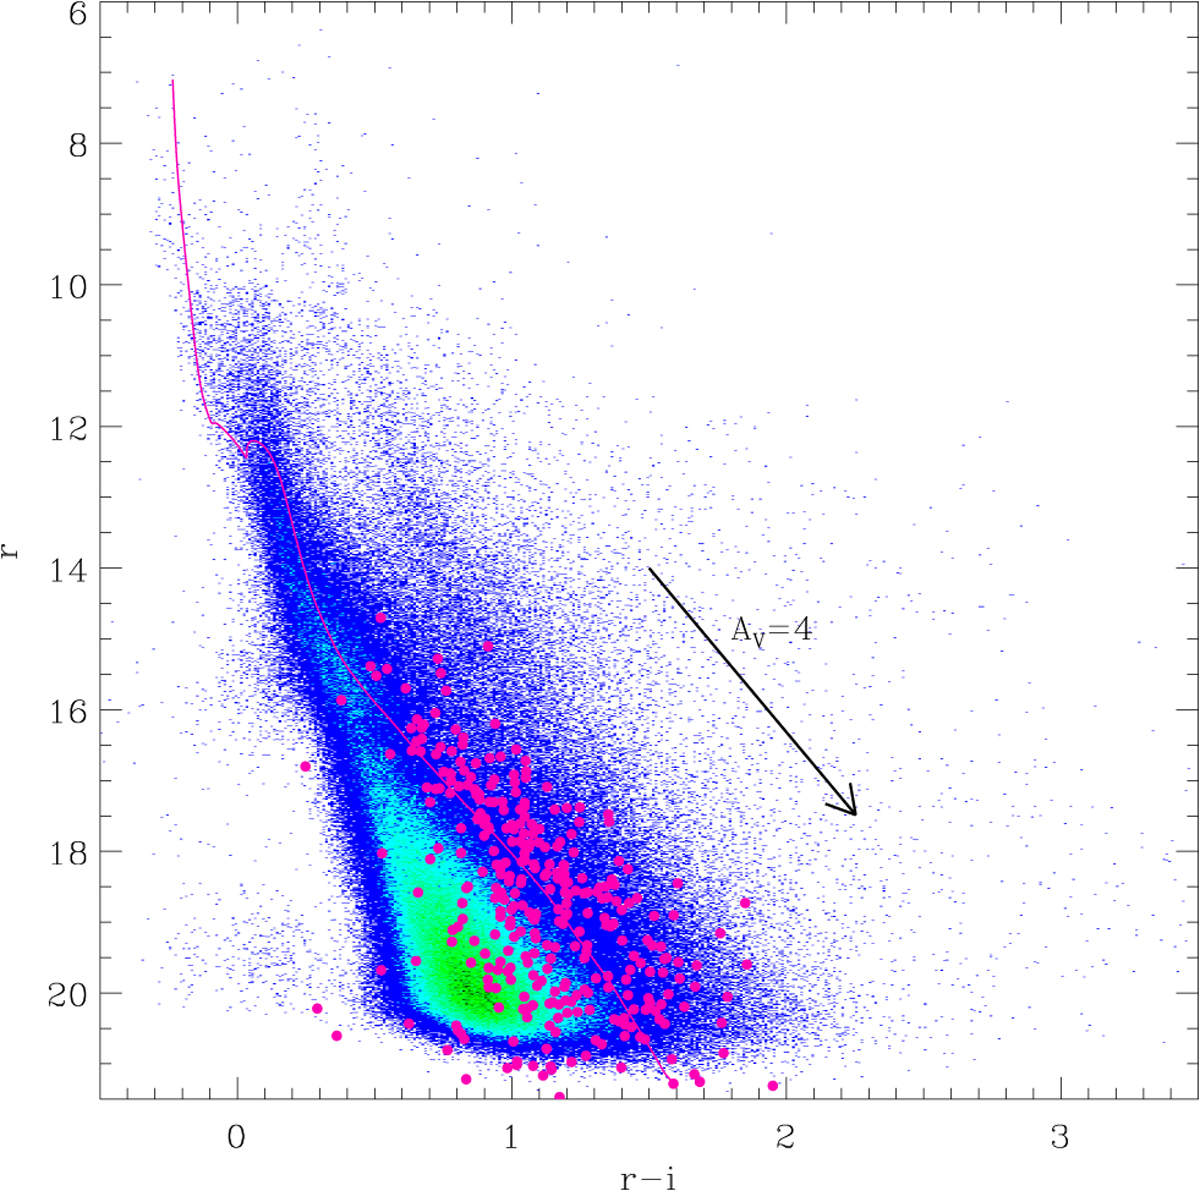
SDSS r vs. r−i diagram plotted as a two-dimensional stellar-density histogram using a binning of 0.01 × 0.01 and a 7 level color-coded scale such that high source densities (70 per bin) are dark-green and the lowest densities (one per bin) are blue. The magenta solid line is the 10 Myr PISA isochrone, assuming a distance of 750 pc and E(B − V) = 0.2. Objects with Hα excesses are drawn as magenta circles.
Current usage metrics show cumulative count of Article Views (full-text article views including HTML views, PDF and ePub downloads, according to the available data) and Abstracts Views on Vision4Press platform.
Data correspond to usage on the plateform after 2015. The current usage metrics is available 48-96 hours after online publication and is updated daily on week days.
Initial download of the metrics may take a while.