Fig. 20
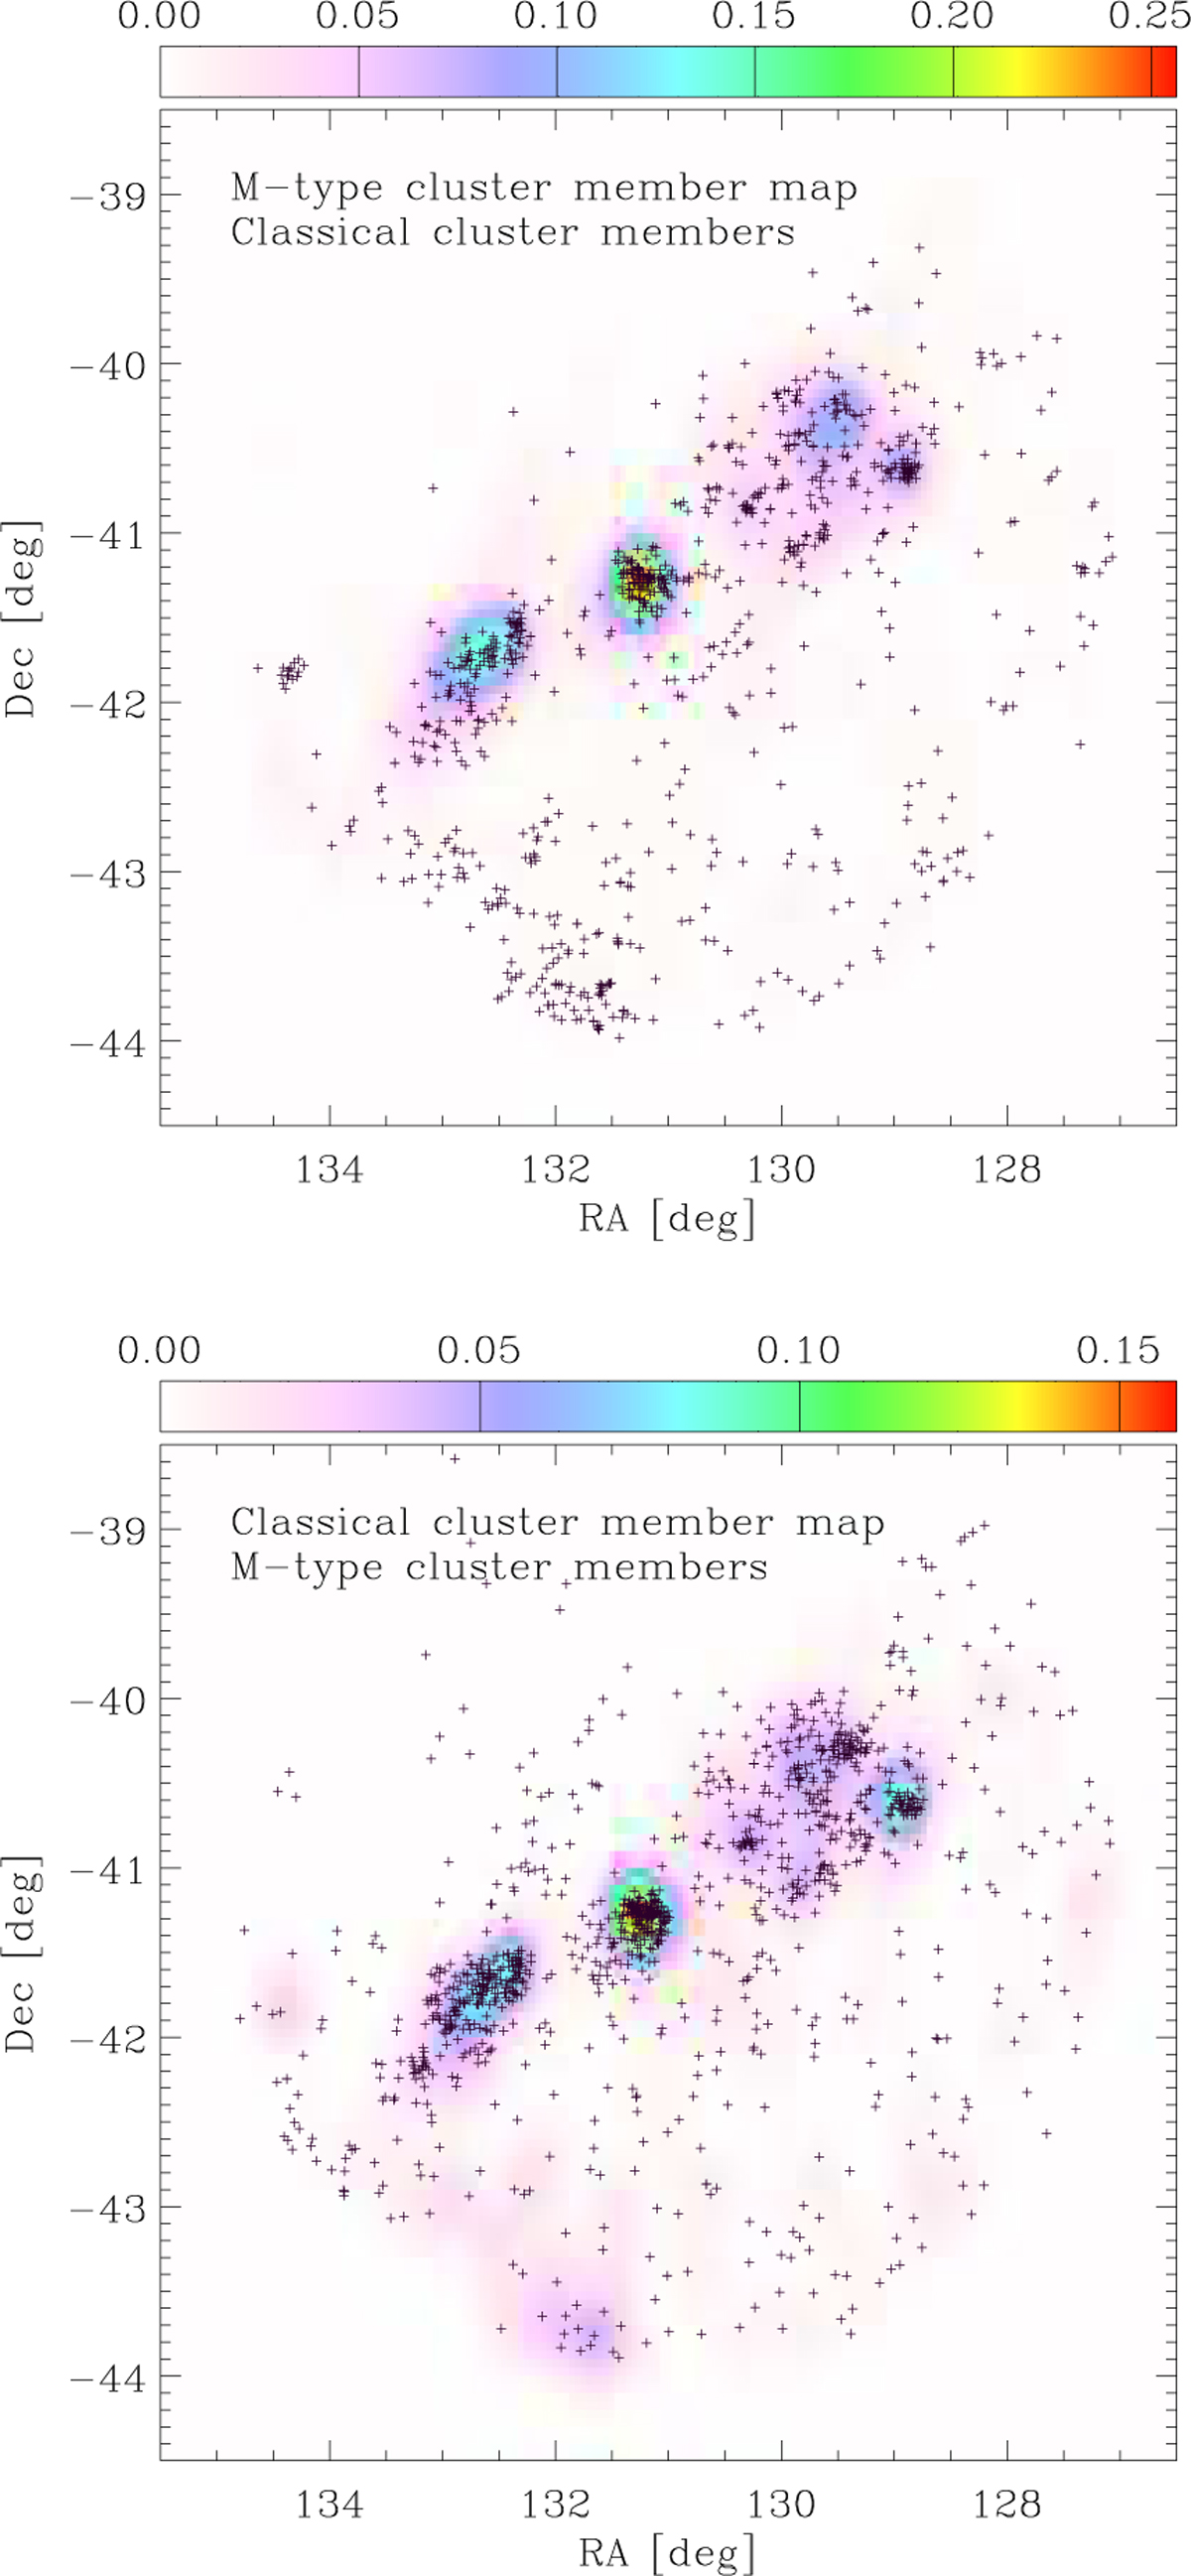
Upper panel: spatial distribution of cluster members selected as M-type PMS stars in Sect. 7.2.2, plotted as a two-dimensional histogram smoothed with a Gaussian kernel. The density scale is the number of stars per bin and per arcmin2. Overplotted black crosses are candidate members selected with classical methods. Lower panel: spatial distribution of cluster members selected with classical methods, plotted as a smoothed two-dimensional histogram. Overplotted black crosses are cluster members selected as M-type PMS stars.
Current usage metrics show cumulative count of Article Views (full-text article views including HTML views, PDF and ePub downloads, according to the available data) and Abstracts Views on Vision4Press platform.
Data correspond to usage on the plateform after 2015. The current usage metrics is available 48-96 hours after online publication and is updated daily on week days.
Initial download of the metrics may take a while.