Fig. 2.
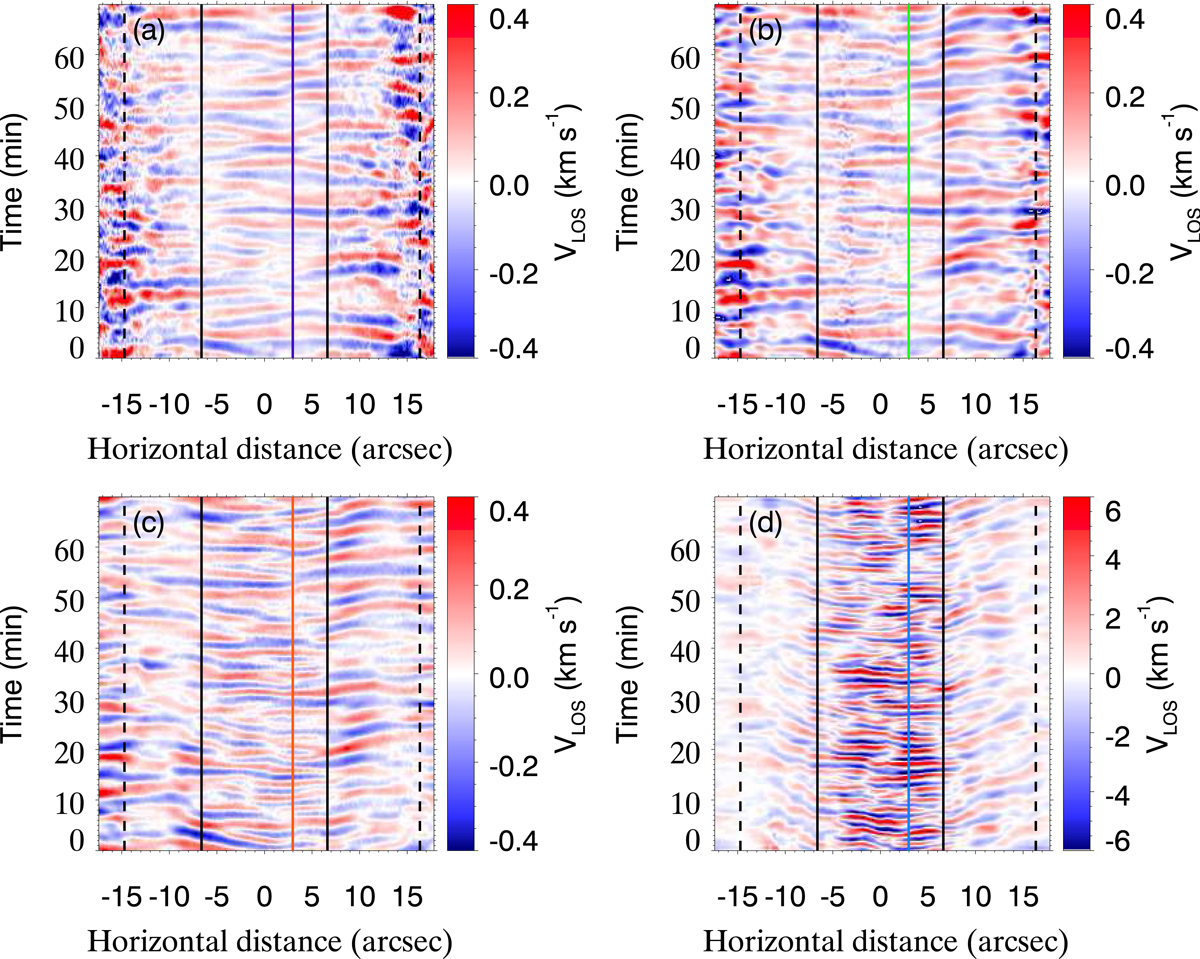
LOS velocity measured with the Ca I 10 839 Å line (panel a), Si I 10 827 Å line (panel b), Fe I 5435 Å line (panel c), and He I 10 830 Å triplet (panel d). The signals have been filtered in the frequency range between 1 and 15 mHz. Positive velocities (red) correspond to downflows and negative velocities (blue) to upflows. The vertical colored lines indicate the umbral location illustrated in Fig. 3.
Current usage metrics show cumulative count of Article Views (full-text article views including HTML views, PDF and ePub downloads, according to the available data) and Abstracts Views on Vision4Press platform.
Data correspond to usage on the plateform after 2015. The current usage metrics is available 48-96 hours after online publication and is updated daily on week days.
Initial download of the metrics may take a while.