Free Access
Fig. 13.
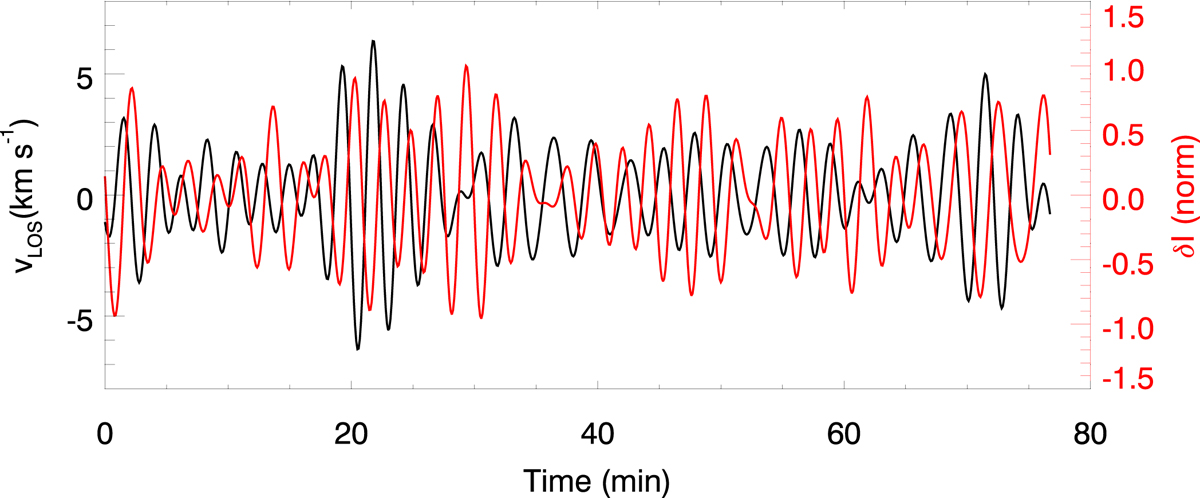
Temporal evolution of the LOS velocity (black line) and core intensity (red line) of the He I 10 830 Å filtered in the 4.5–8 mHz frequency range and spatially averaged for all the umbral spatial locations.
Current usage metrics show cumulative count of Article Views (full-text article views including HTML views, PDF and ePub downloads, according to the available data) and Abstracts Views on Vision4Press platform.
Data correspond to usage on the plateform after 2015. The current usage metrics is available 48-96 hours after online publication and is updated daily on week days.
Initial download of the metrics may take a while.