Fig. 12.
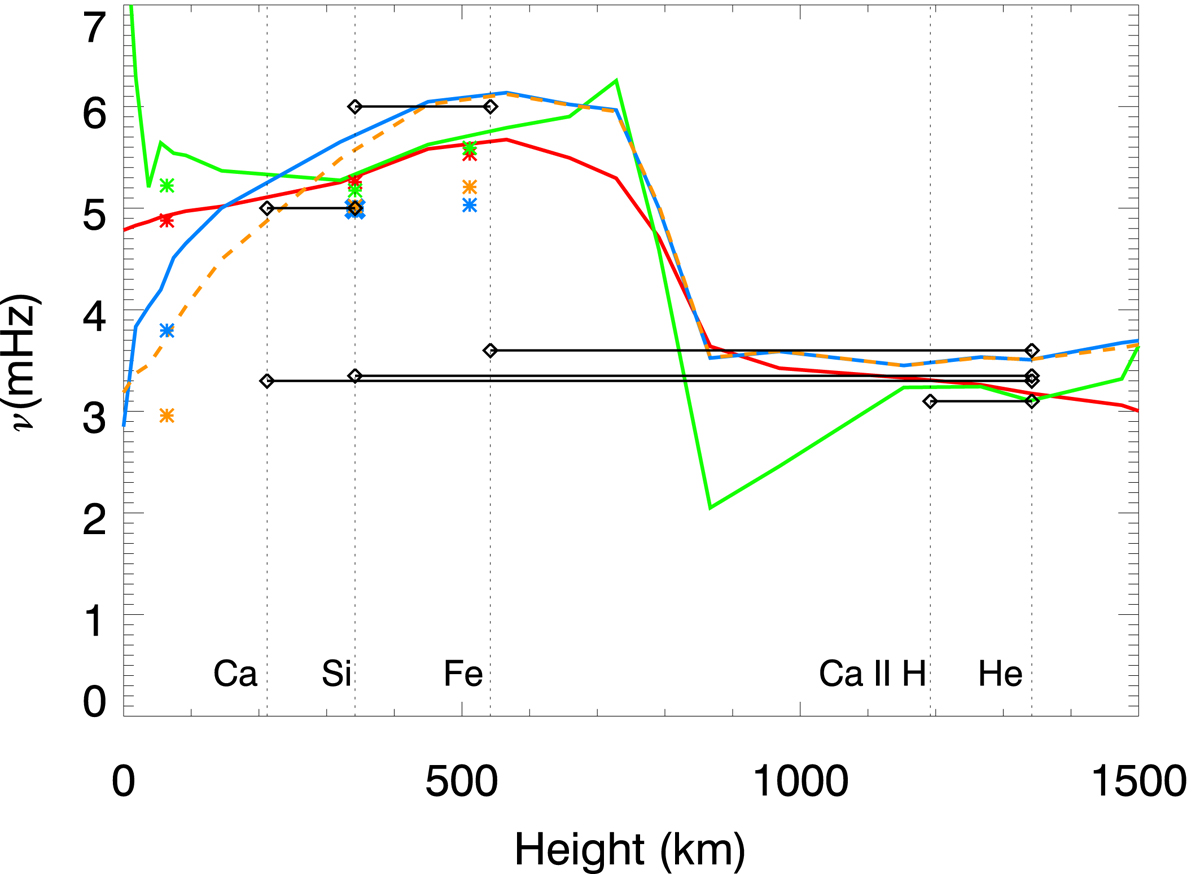
Variation of the cutoff frequency in the umbral atmosphere. Color lines represent the cutoff values computed for Avrett (1981) model and the color asterisks correspond to the cutoffs calculated for the inverted umbral atmosphere. The color indicates the formula used: red (Eq. (1)), green (Eq. (2)), blue (Eq. (3)), and orange (Eq. (4)). Horizontal black lines with diamonds indicate the observational cutoffs as determined from Figs. 6–11 (see Table 1). The black lines cover the range of heights between the formation height of the two lines used for each measurement. Vertical dotted lines indicate the formation height of the spectral lines as determined from the analysis of wave propagation.
Current usage metrics show cumulative count of Article Views (full-text article views including HTML views, PDF and ePub downloads, according to the available data) and Abstracts Views on Vision4Press platform.
Data correspond to usage on the plateform after 2015. The current usage metrics is available 48-96 hours after online publication and is updated daily on week days.
Initial download of the metrics may take a while.